In the previous article of the series “VMware Training. Season 2021-2022” we considered a list of training programs in the direction of Multi-Cloud: VMware vSphere 6.7 and 7.
Today we will talk about the main training programs in the field Multi-Cloud: VMware vSAN 6.7 and 7.
vSAN 6.7 and 7
VMware Virtual SAN (or vSAN) is a distributed storage concept that is fully integrated with VMware vSphere at the ESXi cluster level. vSAN is a software storage system that allows you to abstract from the “iron” data warehouse and work with resource pools without worrying about where the virtual machine data is located.
Prerequisites: Storage administration experience on block or file storage devices. Understanding of concepts presented in the VMware vSphere: Install, Configure, Manage course.
In this course, students focus on deploying and managing a software-defined storage solution using VMware vSAN 6.7. The course provides knowledge of how vSAN, an important component of the VMware data center software, functions. Students receive practical experience working with vSAN concepts and perform hands-on laboratory exercises.
Prerequisites: Understanding of concepts presented in the VMware vSphere: Install, Configure, Manage course. Storage administration experience with block or file storage devices.
This two-day, hands-on training course provides you with the knowledge, skills, and tools to plan and deploy a VMware vSAN cluster. In this course, you are taught the many considerations that the vSAN configuration has on the initial planning of the vSAN datastore. You also manually configure a vSAN cluster.
Target Audience: Storage and virtual infrastructure administrators.
Prerequisites: Completion of the following courses is required:
VMware vSphere: Install, Configure, Manage [v7] or equivalent knowledge
VMware vSAN: Plan and Deploy [v7].
In this three-day course, you learn about managing and operating VMware vSAN 7. This course focuses on building the required skills for common Day-2 vSAN administrator tasks such as, vSAN node management, cluster maintenance, security operations and advanced vSAN cluster operations. You also gain practical experience through the completion of instructor-led activities and hands-on lab exercises.
Prerequisites: Before taking this course, students should take the following courses or have equivalent knowledge and experience:
VMware vSphere: Install, Configure, Manage;
VMware vSAN: Plan and Deploy;
VMware vSAN: Management and Operations.
In this two-day course, you focus on learning the tools and skills necessary to troubleshoot VMware vSAN 7 implementations. You gain practical experience with vSAN troubleshooting concepts through the completion of instructor-led activities and hands-on lab exercises.
Brief Summary
In this article, we got acquainted with the main training programs in the field of Multi-Cloud: VMware vSAN 6.7 and 7.
In the next publication of the cycle “VMware Training. Season 2021-2022” we will talk about training programs in the field of Multi-Cloud: VMwareSite Recovery Manager.
Follow the news until the meeting is on air in a few days. Sincerely, AIRRA.
Hello to all readers of the blog about IT Architecture and Learning!
Last year we published a series of articles “VMware Practice. Year 2020”. VMware recently released an updated catalog of Hands-On Labs.
So, we’re starting a new series of articles called “VMware Practice. Season 2021-2022.”, in which we will consider all new Hands-On Lab of VMware and we will update the information on previous versions of Labs.
To begin with, let us briefly recall last year’s topics in this area.
Practice
Recently in the series of articles “VMware Training. Season 2021-2022” we talked about the training programs for authorized learning VMware 2021-2022 season. Today we will talk about one of the options for gaining practical skills in working with VMware technologies.
During the authorized study, students have access to the laboratory environment in which they perform tasks according to the course scenario. This is enough to gain basic technology skills. However, after the end of the course, this access is terminated, and to consolidate skills, such a laboratory must be constantly available, and training in a productive environment is a very bad idea.
There are several main options: to create a permanent laboratory or even a home one mini data center, or take advantage of a special resource from VMware – Hands-on Labs.
What is HOL (Hands-on Labs)?
So what is a HOL (Hands-on Labs)?
VMware Hands-on Labs provide a quick and easy way to access VMware products and solutions, testing use cases and learning about the latest features with no installation required. There are no special hardware or licenses needed. VMware Hands-on Labs delivers a real, virtualized infrastructure in the cloud using VMware managed infrastructure including vCloud Foundation, vRealize Operations, VMware Learning Platform, Wavefront and more. Best of all, they are provided at no charge and you only need a modern browser to run them. All labs are created by product experts, documented and supported by the VMware Hands-on Labs team and community.
Hands-on Labs types
In general, there are three types of Hands-on Labs:
Lightning Labs;
Comprehensive Labs;
Odyssey Game Labs.
Lightning Labs – The quickest and easiest way to experience VMware products in 30-minutes or less. Lightning Labs help you experience and evaluate VMware products in small segments of time. “Bite-sized” labs allow you to learn about core product features quickly!
Comprehensive Labs – Dive deep into VMware products features and capabilities with full guided labs. Experience the full range of VMware products and learn about new features. Up and running on any browser in minutes and 100% free. No installation, licenses, or special hardware required. Relevant content available and updated year round.
Odyssey Game Labs – Test your knowledge and skills of VMware products by completing tasks. Where will you rank on the leaderboard? VMware Odyssey are short tasks that challenge your knowledge of VMware products and solutions. Go against the clock and players online to top the leaderboard! Get instant feedback on your progress. Sharpen your skills and showcase your technical expertise.
Brief Summary
So, from this short publication you learned about VMware Hands-on Labs, about the types of labs. Since this resource is absolutely free, and only a modern browser is required for access, I advise you to bookmark the address of the resource “VMware Hands-on Labs” and quickly register and read a fairly large catalog of laboratory work.
And in the next publication, we will talk about the main available laboratory work in the direction of Lightning Labs, for a quick introduction to the technologies of VMware.
Follow the news until the meeting is on air in a few days. Sincerely, AIRRA.
Hello to all readers of the blog about IT Architecture and Learning!
In the previous article of the series “VMware Training. Season 2021-2022” we considered a list of areas and specifics of authorized learning VMware.
Today we will talk about the main training programs in the field of Multi-Cloud.
Direction of training – Multi-Cloud includes training programs on VMware vSphere, vSAN, Site Recovery Manager, VMware Cloud Foundation, VMware Intergrated OpenStack, vRealize Suite Lifecycle Manager, Automation, Orchestrator, Operations, Log Insight, VMware Cloud Director technologies.
The number of training programs on these products is quite large, so today we will talk only about the direction of the VMware Sphere 6.7 and 7.
VMware vSphere 6.7
VMware vSphere is server virtualization software and the heart of a Software-Defined Data Center (SDDC) that helps you run, manage, connect and secure applications in a shared cloud operating environment.
The main current training programs for vSphere 6.7 technologies are:
Prerequisites: System administration experience on Microsoft Windows or Linux operating systems.
Certification: Attending this course meets the training requirement to achieve the following certification: VMware Certified Professional – Data Center Virtualization (VCP-DCV).
This five-day course features intensive hands-on training that focuses on installing, configuring, and managing VMware vSphere 6.7, which includes VMware ESXi 6.7 and VMware vCenter Server 6.7. This course prepares you to administer a vSphere infrastructure for an organization of any size. This course is the foundation for most of the other VMware technologies in the software-defined data center.
Target audience: Senior Administrators, Implementers and Consultants, Architects.
Prerequisites: Understanding of concepts presented in the VMware vSphere: Install, Configure, Manage course.
Certification: Attending this course meets the training requirement to achieve the following certification: VMware Certified Professional – Data Center Virtualization (VCP-DCV).
This five-day course teaches you advanced skills for configuring and maintaining a highly available and scalable virtual infrastructure. Through a mix of lecture and hands-on labs, you configure and optimize the VMware vSphere 6.7 features that build a foundation for a truly scalable infrastructure, and you discuss when and where these features have the greatest effect. Attend this course to deepen your understanding of vSphere and learn how its advanced features and controls can benefit your organization..
Target audience: Senior Administrators, Implementers and Consultants, Architects.
Prerequisites: System administration experience on Microsoft Windows or Linux operating systems.
Certification: Attending this course meets the training requirement to achieve the following certification: VMware Certified Professional – Data Center Virtualization (VCP-DCV).
This five-day, intensive course takes you from introductory to advanced VMware vSphere management skills. Building on the installation and configuration content from our best-selling course, you will also develop advanced skills needed to manage and maintain a highly available and scalable virtual infrastructure. Through a mix of lecture and hands-on labs, you will install, configure and manage vSphere 6.7. You will explore the features that build a foundation for a truly scalable infrastructure, and discuss when and where these features have the greatest effect. This course prepares you to administer a vSphere infrastructure for an organization of any size using vSphere 6.7, which includes VMware ESXi 6.7 and VMware vCenter Server 6.7.
Target audience: Senior system administrators, experienced system administrators.
Prerequisites: VMware Certified Professional 6.5 – Data Center Virtualization (VCP6.5-DCV) or VMware vSphere: Install, Configure, Manage [V6.7] (with two years production experience) or VMware vSphere: Optimize and Scale [V6.7] or VMware vSphere: Troubleshooting Workshop [V6.7] or VMware vSphere: Fast Track [V6.7] or Equivalent knowledge and administration experience with ESXi and vCenter Server. Experience in working with a command-line interface is highly recommended, as is completion of VMware vSphere: Optimize and Scale [V6.7].
This five-day, intensive hands-on training workshop provides you with advanced knowledge, skills, and abilities to achieve competence in troubleshooting the VMware vSphere 6.7 environment. This workshop is aimed at experienced system administrators and introduces methods and skills that use management command-line interfaces (CLIs) and VMware vSphere Client. This workshop focuses on investigating and resolving problems, analyzing log files to help you recognize log file entries that identify root causes, and configuring specific key vSphere features.
Target audience: System administrators and engineers, with beginner to intermediate knowledge of vSphere, who want to gain proficiency in the management of the vSphere lifecycle.
In this five-day workshop, you perform various tasks that a system administrator performs on a regular basis. These tasks include updating and upgrading an existing basic VMware vSphere environment and troubleshooting common problems. You apply the concepts learned during the VMware vSphere: Install, Configure, Manage [V6.7] course, while you increase your skill and competence.
VMware vSphere 7
New version of vSphere 7 – the biggest innovation since the launch of ESXi – Unified management technology for Containers and VMs.
The main current training programs for vSphere 7 technologies are:
Prerequisites: Working knowledge of operating systems and Understanding of basic network, storage, and computer hardware concepts.
Certification: Attending this course is recommended to achieve the following certification: VMware Certified Technical Associate – Data Center Virtualization (VCTA-DCV).
This four-day, hands-on training course is an introduction to VMware vSphere. In this course, you acquire the skills needed to perform Day 2 operational tasks that are typically assigned to the roles of operator or junior administrator in a vSphere environment.
Certification: Attending this course allows candidates who hold a valid VCP-DCV 2019 to upgrade to VCP-DCV 2020 without taking the certification exam.
In this three-day, hands-on training course, you explore the new features and enhancements in VMware vCenter Server 7 and VMware ESXi 7. Real-world use-case deployment scenarios, hands-on lab exercises, and lectures teach you the skills that you need to effectively implement and configure VMware vSphere 7. This course is recommended for customers who want to deploy vSphere 7 in their existing vSphere environment.
Prerequisites: System administration experience on Microsoft Windows or Linux operating systems.
Certification: Attending this course meets the training requirement to achieve the following certification: VMware Certified Professional – Data Center Virtualization (VCP-DCV).
This five-day course features intensive hands-on training that focuses on installing, configuring, and managing VMware vSphere 7, which includes VMware ESXi 7 and VMware vCenter Server 7. This course prepares you to administer a vSphere infrastructure for an organization of any size. This course is the foundation for most of the other VMware technologies in the software-defined data center.
Target audience: Senior Administrators, Implementers and Consultants, Architects.
Prerequisites: Completion of VMware vSphere: Optimize and Scale [V7] course; VMware Certified Professional – Data Center Virtualization (VCP-DCV) certification; System administration experience on Microsoft Windows or Linux operating systems
Certification: The course aligns fully with the VMware Certified Advanced Professional – Data Center Virtualization Deploy exam objectives.
This five-day course provides hands-on training to equip students with a range of skills: from performing routine VMware vSphere 7 administrative tasks to complex vSphere operations and configurations. Through lab-based activities, students are immersed in real-life situations faced by VMBeans, a fictitious company. These situations expose students to real-life scenarios faced by companies that are building and scaling their virtual infrastructure.
This course uses scenario-based lab exercises and does not provide guided step-by-step instructions. To complete the scenario-based lab exercises, you are required to analyze the task, research, and deduce the required solution. References and suggested documentation are provided.
Approximately 90% of the class is application-focused and taught through labs.
Target audience: Senior Administrators, Implementers and Consultants, Architects.
Prerequisites: Understanding of concepts presented in the VMware vSphere: Install, Configure, Manage course.
Certification: Attending this course meets the training requirement to achieve the following certification: VMware Certified Professional – Data Center Virtualization (VCP-DCV).
This five-day course teaches you advanced skills for configuring and maintaining a highly available and scalable virtual infrastructure. Through a mix of lecture and hands-on labs, you configure and optimize the VMware vSphere 7 features that build a foundation for a truly scalable infrastructure, and you discuss when and where these features have the greatest effect. Attend this course to deepen your understanding of vSphere and learn how its advanced features and controls can benefit your organization..
Target audience: Senior Administrators, Implementers and Consultants, Architects.
Prerequisites: VMware vSphere: Install, Configure, Manage. Experience in working with a command-line interface is highly recommended, as is completion of VMware vSphere: Optimize and Scale.
Certification: Attending this course meets the training requirement to achieve the following certification: VMware Certified Professional – Data Center Virtualization (VCP-DCV). Attending this course is also recommended if you aim to achieve the following certification: VMware Certified Advanced Professional – Data Center Virtualization (VCAP-DCV) Deploy.
This five-day, hands-on training course provides you with the advanced knowledge, skills, and abilities to achieve competence in troubleshooting the VMware vSphere 7.x environment. This workshop increases your skill and competence in using the command-line interface, VMware vSphere Client, log files, and other tools to analyze and solve problems.
Target audience: Senior Administrators, Implementers and Consultants, Architects.
Prerequisites: System administration experience on Microsoft Windows or Linux operating systems.
Certification: Attending this course meets the training requirement to achieve the following certification: VMware Certified Professional – Data Center Virtualization (VCP-DCV).
This five-day, intensive course takes you from introductory to advanced VMware vSphere 7 management skills. Building on the installation and configuration content from our best-selling course, you will also develop advanced skills needed to manage and maintain a highly available and scalable virtual infrastructure. Through a mix of lecture and hands-on labs, you will install, configure and manage vSphere 7. You will explore the features that build a foundation for a truly scalable infrastructure and discuss when and where these features have the greatest effect. This course prepares you to administer a vSphere infrastructure for an organization of any size using vSphere 7, which includes VMware ESXi 7 and VMware vCenter Server 7.
● VMware vSphere: Optimize and Scale plus Troubleshooting Fast Track [V7]
Duration: 5 days.
Level of difficulty: Advanced.
Target audience: Senior Administrators, Implementers and Consultants, Architects.
Prerequisites: Completion of the VMware vSphere: Install, Configure, Manage [V7] course Or Equivalent knowledge and administration experience with ESXi and vCenter Server. Experience in working at the command prompt is highly recommended.
Certification: Attending this course meets the training requirement to achieve the following certification: VMware Certified Professional – Data Center Virtualization (VCP-DCV).
This five-day, accelerated, hands-on training course is a blend of the VMware vSphere: Optimize and Scale and VMware vSphere: Troubleshooting courses. This Fast Track course includes topics from each of these advanced courses to equip experienced VMware administrators with the knowledge and skills to effectively optimize and troubleshoot vSphere at an expert level.
Attend a VMware delivered Fast Track course and receive a free VCP Exam voucher to use toward certification.
Target audience: Implementers and Consultants, Architects.
Prerequisites: Completion of the VMware vSphere: Install, Configure, Manage and VMware vSphere: Optimize and Scale courses.
Certification: This course is recommended if you aim to achieve the following certification: VMware Certified Advanced Professional – Data Center Virtualization (VCAP-DCV) Design.
This three-day training course equips you with the knowledge, skills, and abilities to design a VMware vSphere 7 virtual infrastructure. You follow a proven approach to design a virtualization solution that ensures availability, manageability, performance, recoverability, and security, and that uses VMware best practices. This course discusses the benefits and risks of available design alternatives and provides information to support making sound design decisions. Given a case study, you practice your design skills by working with peers on a design project.
● VMware vSphere with Tanzu: Deploy and Manage [V7]
Duration: 3 days.
Level of difficulty: Intermediate.
Target audience: Experienced system administrators and system integrators responsible for designing and implementing vSphere with Tanzu.
Prerequisites: Completion of the VMware vSphere: Install, Configure, Manage or VMware vSphere: Optimize and Scale AND VMware NSX-T Data Center: Install, Configure, Manage courses.
During this 3-day course, you focus on deploying and managing VMware vSphere with Tanzu. You learn about how vSphere with Tanzu can be used to orchestrate the delivery of Kubernetes clusters and containerized applications in a vSphere environment.
Brief Summary
In this article, we are introduced to training programs in the direction of Multi-Cloud: VMware vSphere 6.7 and 7.
In the next publication of the cycle “VMware Training. Season 2021-2022” we will talk about training programs in Multi-Cloud: VMware vSAN directions.
Follow the news until the meeting is on air in a few days. Sincerely, AIRRA.
So, we’re starting a new series of articles called “VMware Training. Season 2021-2022”, in which we will consider all new educational directions of VMware and we will update the information on previous versions of courses.
To begin with, let us recall the features of authorized training.
Authorized Training
Authorized training from the vendor is a pointer to the best way to master this or that technology. Training programs vary in duration, difficulty level, target audience, training format. Given the trends of recent events in the world, training centers will have to reorient themselves mainly to online learning.
The main components of authorized training are branded textbooks, access to the laboratory environment during training, certified instructors. The training programs themselves are focused on official international certification and are based on new versions of products and technologies, reflect the latest advances in virtualization and cloud technologies in VMware. The content of the Authorized trainings of the last generation have a practice-oriented nature and form the professional competencies of the specialist. VMware provides an equally high level of education, regardless of the location of the training center, controls the content of courses, provides educational and methodological and technical support. There is a system and regulations for training and certification of instructors. An independent certification system allows course participants to obtain internationally recognized documents. Different forms of training allow students to choose the most convenient training option.
To understand the list of training programs and directions, you must visit the official resource: VMware Learning and the corresponding section with the areas of study: Learning Paths.
Learning Paths
In the last school season 2020-2021 in Vmware Education were formed four major product areas of study:
Data Center Virtualization & Hybrid Cloud Infrastructure;
Network Virtualization & Security;
Virtualization & Cloud Management Platform;
Desktop, Application Virtualization & Mobility.
Now there are five such major product areas:
Multi-Cloud;
Virtual Cloud Network;
Digital Workspace;
App Modernization;
Intrinsic Security.
Brief Summary
In this article, we have read the list of areas and specifics of authorized training VMware. In the next post, we will learn about Multi-Cloud training programs.
Follow the news until the meeting is on air in a few days. Sincerely, AIRRA.
Congratulations to all who have been looking forward to the next post in the series “My Smart Home. From the beginning, Step by step to… ”. At the moment we have a working copy of the Home Assistant. From the software applications we have the File Editor and Terminal. We made the first settings in the configuration.yaml configuration file and updated the system to the current version.
Today we will talk about Sensors for monitoring the parameters of the hardware system – Raspberry Pi Power Quality Control Sensor and Processor Temperature sensor. It is also important to know about the health of the software part of the Home Assistant system: we configure the Sensors to monitor the status of the Processor, Memory, Disk and Network. Home Assistant stores the collected data in a database, so we will monitor the growth of its volume with an appropriate sensor. With the help of integration, we will control the Internet connection. We will also configure communication with external devices: configure the control sensors of the Uinterruptible Power Supply.
So, get comfortable, it will be interesting!
Sensors for monitoring system parameters.
All the functioning of our Smart Home depends on the reliable work of the Home Assistant. We entrust control of the basic parameters to the corresponding sensors. Of the hardware, it is the Raspberry Pi power quality control sensor and the processor temperature sensor. From software, – control of loading of the processor, memory, a disk, a network. It is also important to control Internet access settings.
Let’s start with hardware sensors.
● ● ●
Raspberry Pi Power Quality Control Sensor.
On all models of Raspberry Pi since the Raspberry Pi B+ (2014) except the Zero range, there is low-voltage detection circuitry that will detect if the supply voltage drops below 4.63V (+/- 5%). This will result in a warning icon being displayed on all attached displays and an entry being added to the kernel log.
Raspberry Pi Power Supply Checker is based on this algorithm. In the Home Assistant, it is activated by adding the integration component of the same name.
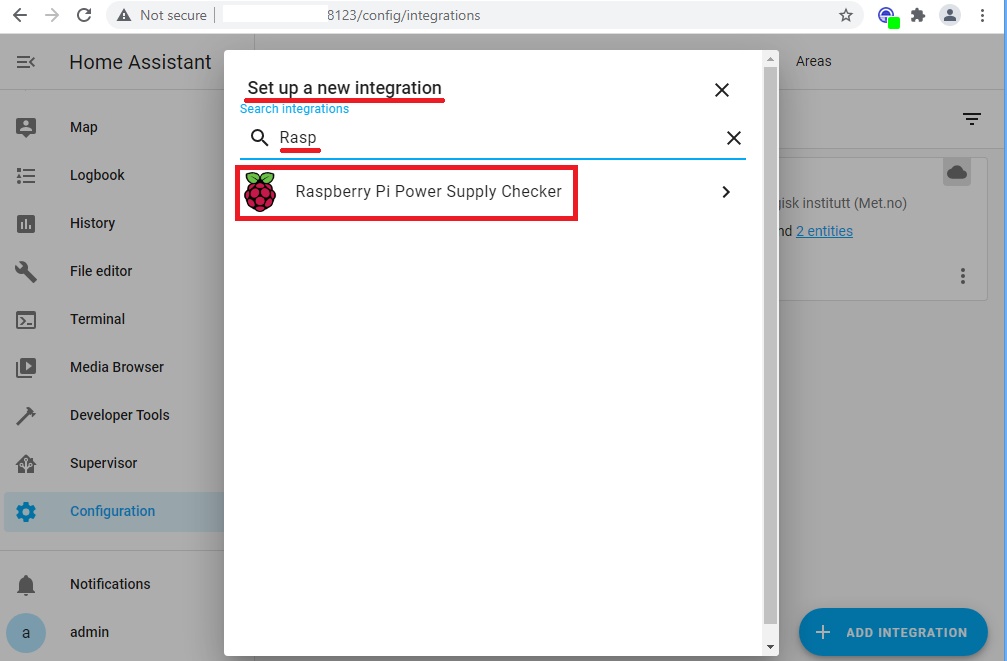
To add this component to the integration, use the Configuration menu, Integration tab. Choose + Add Integration:
Figure 1: We begin the stage of adding and configuring the integration component Raspberry Pi Power Supply Checker.
In the new window Set up a new integration in the search field enter Rasp. The search result should be displayed as a found integration component Raspberry Pi Power Supply Checker:
Figure 2: Search for the integration component Raspberry Pi Power Supply Checker.
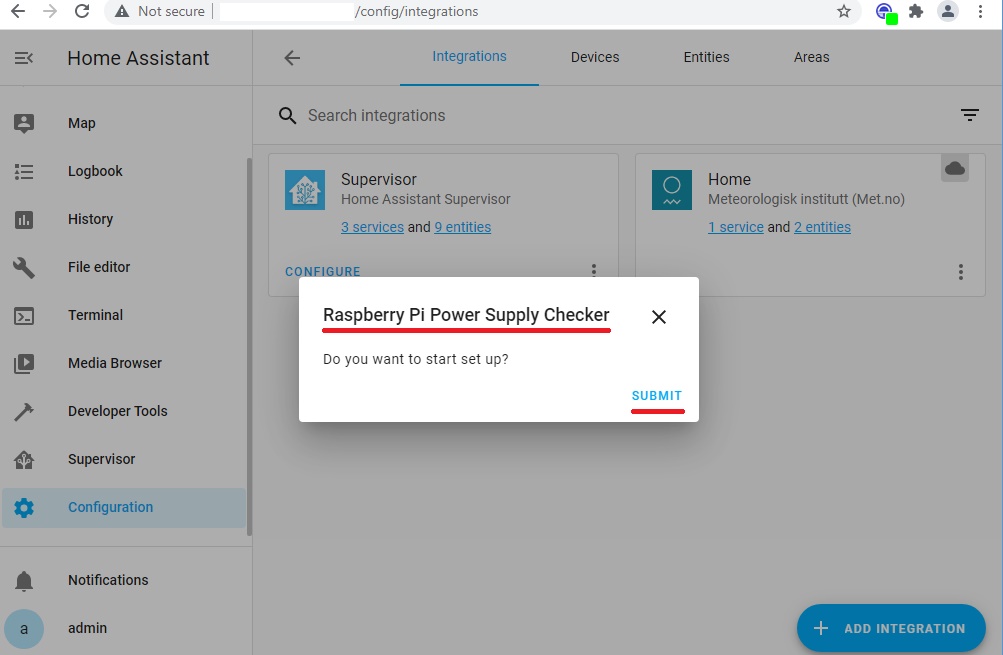
We confirm the installation of the Raspberry Pi Power Supply Checker integration component:
Figure 3: Request to confirm the installation of the Raspberry Pi Power Supply Checker integration component.
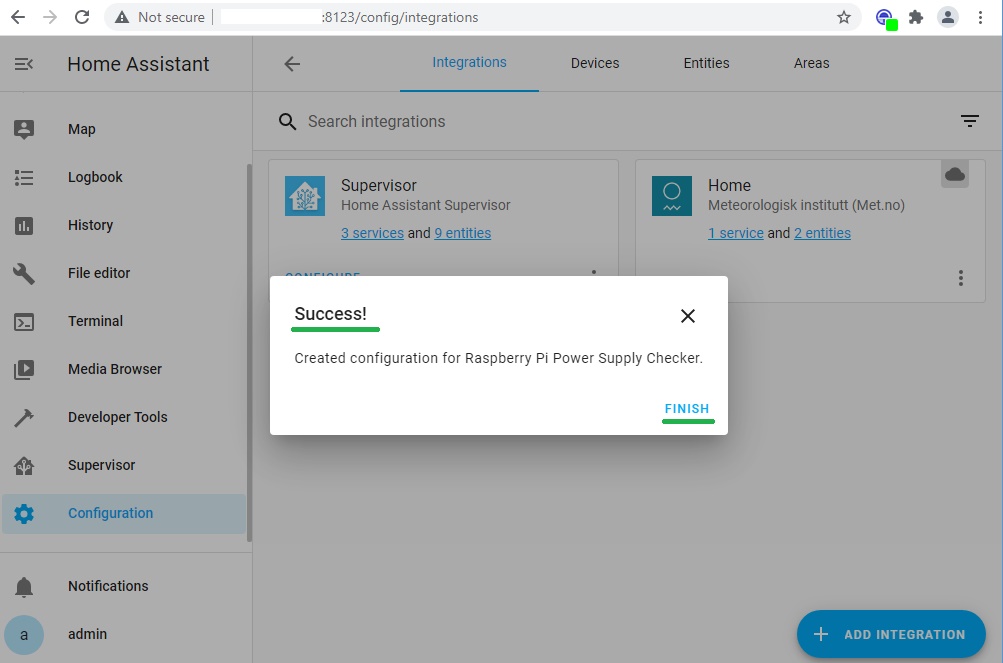
If the Raspberry Pi Power Supply Checker is successfully installed, we receive the following message:
Figure 4: Raspberry Pi Power Supply Checker is successfully installed:
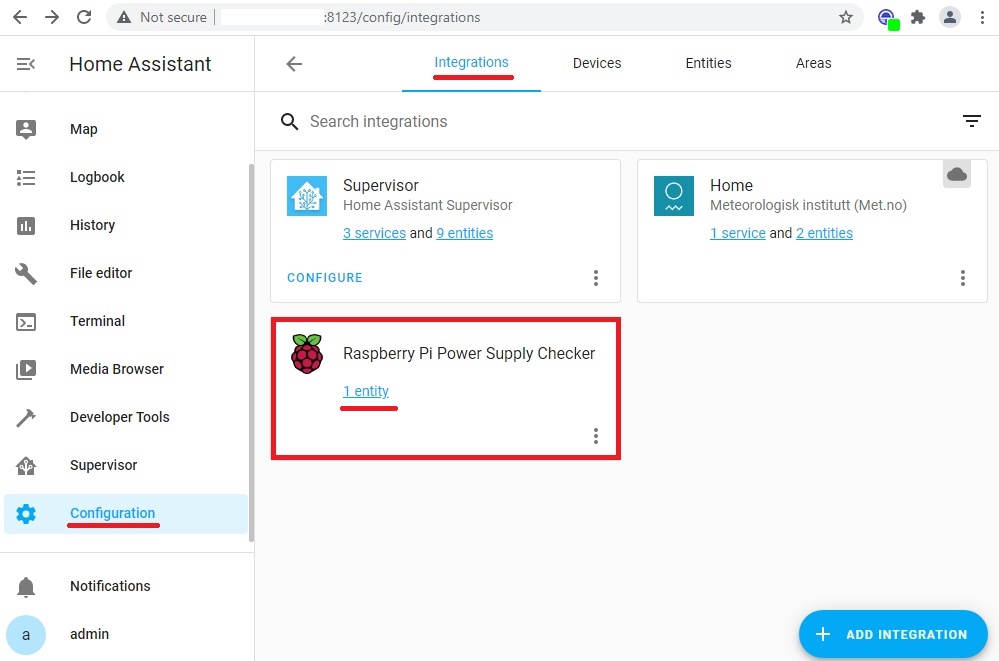
And the newly installed component will appear in the list of integrations:
Figure 5: List of installed integration components in which the newly installed Raspberry Pi Power Supply Checker appeared.
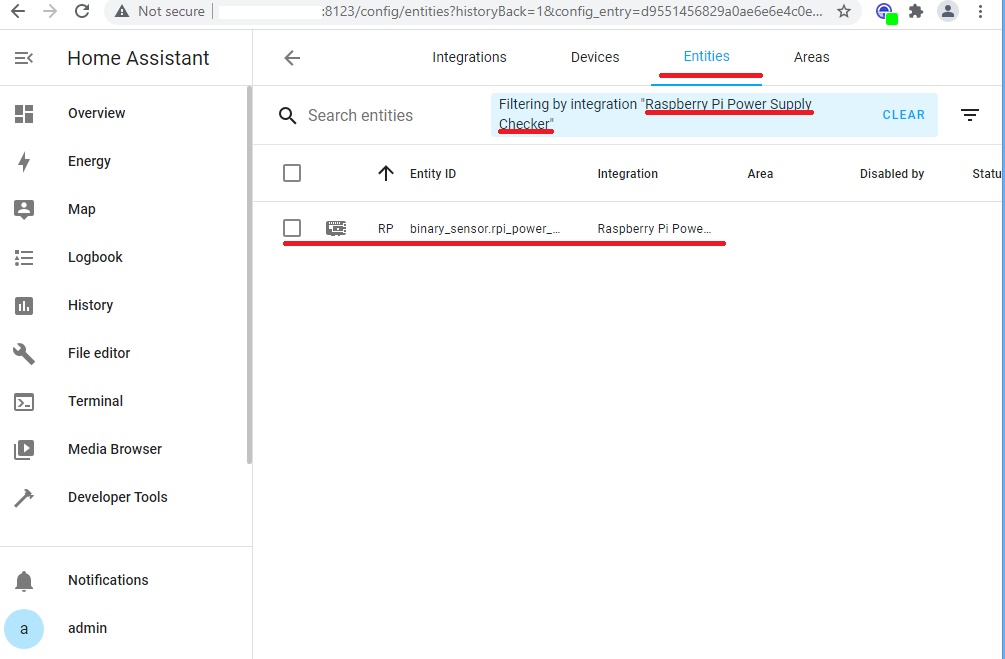
Select the link – 1 entity, and on the Entity tab we will get the filter of integration elements “Raspberry Pi Power Supply Checker”:
Figure 6: Filtered integration elements “Raspberry Pi Power Supply Checker”.
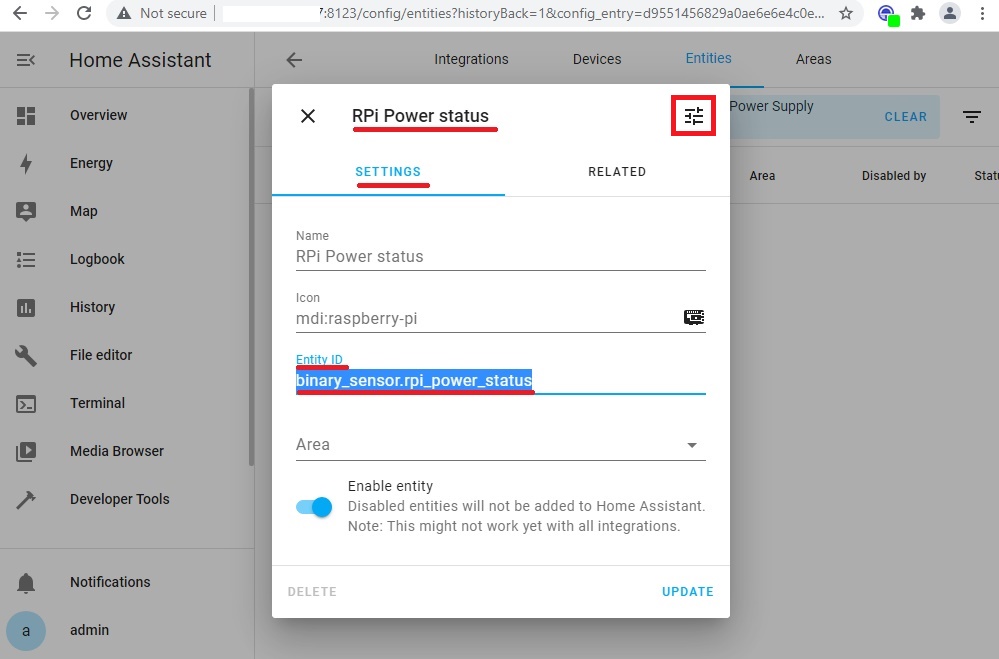
Let’s select this filtered element and find out some of its parameters in the RPi Power Status pop-up window. We are primarily interested in Entity ID: binary_sensor.rpi_power_status. Let’s write down this meaning for ourselves, we will need it later.
Figure 7: Basic parameters of the integration element “Raspberry Pi Power Supply Checker”.
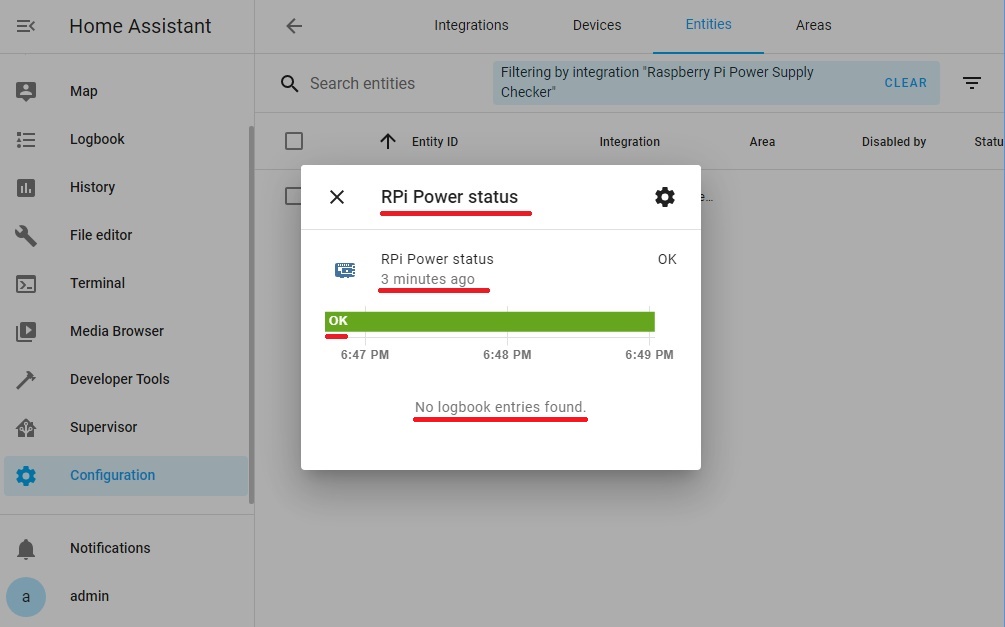
We will also open another RPi Power Status pop-up window using the icon at the top right. But we will see the status of the sensor, and the message that the history of the change has already begun to work, and events in the logbook are not yet found. This is normal because the state of the sensor has not changed since installation.
Figure 8: RPi Power sensor status and change history.
This concludes the work with this element of integration. A little later, we will adjust the display of this sensor on the Lovelace panels of the Home Assistant.
● ● ●
Raspberry PI 4 Processor Temperature sensor.
Our copy of the Raspberry Pi will be housed in a case mounted on a din rail of the electrical switchboard. Therefore, the issue of cooling is very important. Before choosing a cooling strategy, let’s evaluate the actual values of the temperature sensor of the Raspberry PI 4 Processor. Especially since Home Assistant himself has every opportunity to do so.
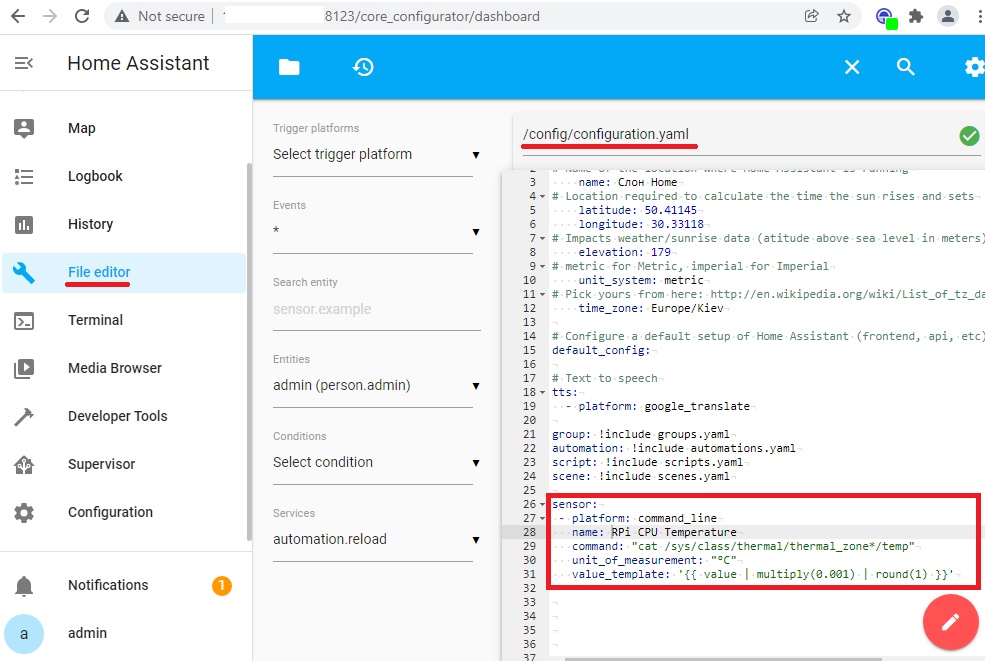
So, let’s create a temperature sensor for the Raspberry PI 4 processor. To do this, add the following code section to the configuration.yaml file:
sensor:
 - platform: command_line
   name: RPi CPU Temperature
   command: "cat /sys/class/thermal/thermal_zone*/temp"
   unit_of_measurement: "°C"
   value_template: '{{ value | multiply(0.001) | round(1) }}'
Figure 9: Raspberry PI 4 processor temperature sensor settings in the configuration.yaml configuration file.
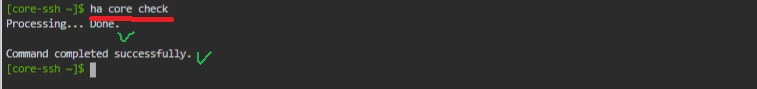
Let’s check the configuration:
ha core check
Figure 10: Check the configuration of the Home Assistant OS.
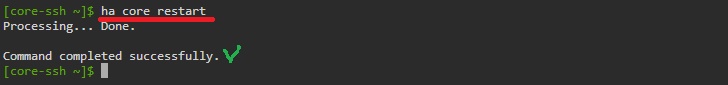
And reboot the system.
ha core restart
Figure 11: Restart the Home Assistant Core to apply the new settings.
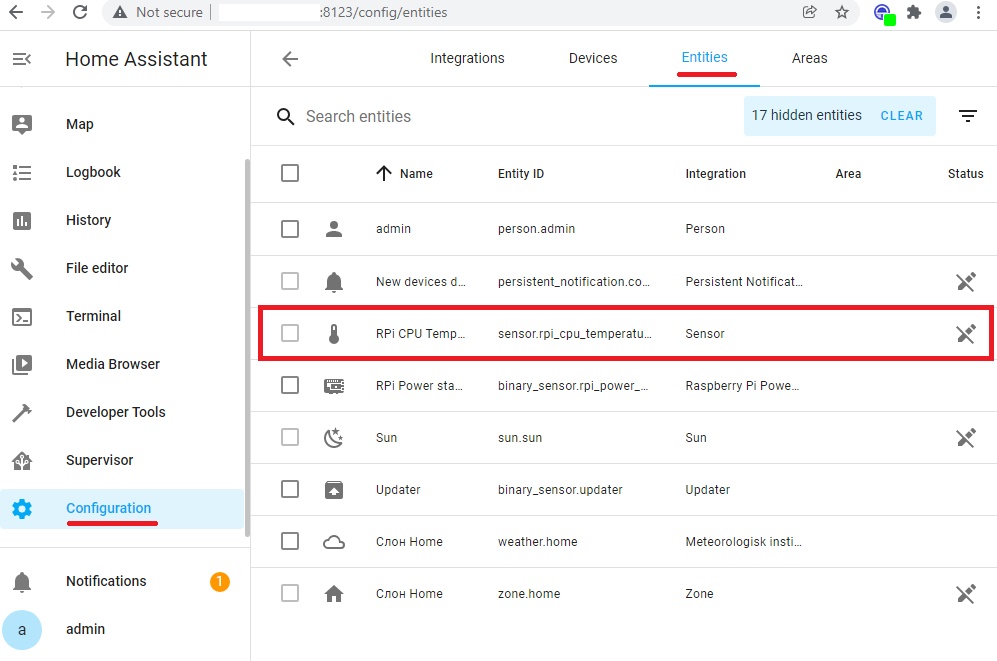
Check the presence of the added sensor in the Configuration menu on the Entities tab.
Figure 12: Check the availability of the Raspberry PI 4 processor temperature sensor in Entities list.
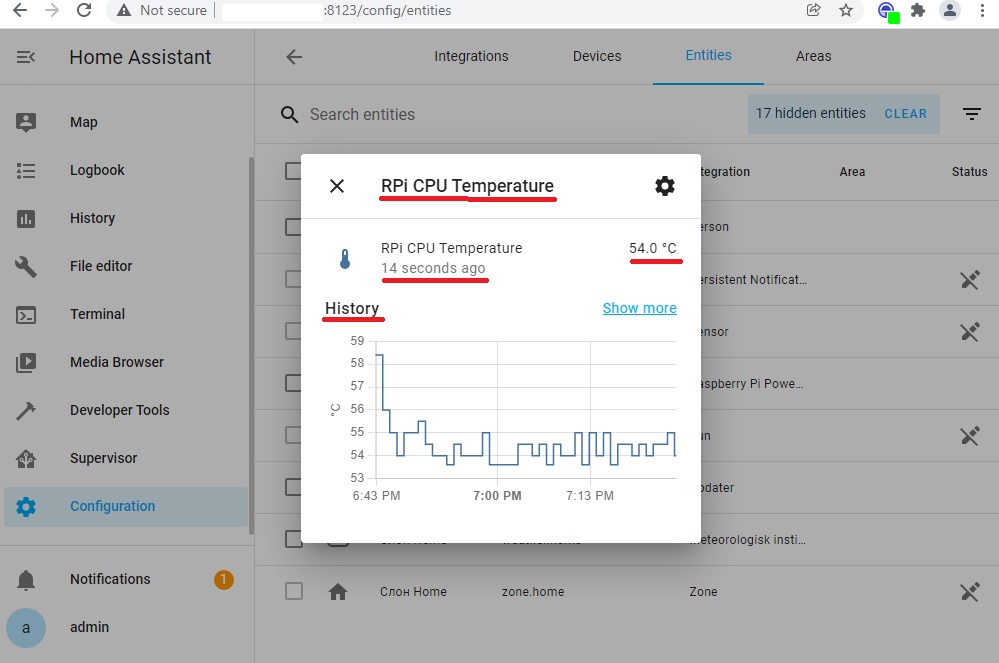
Select this item and immediately open another RPi CPU Temperature pop-up using the icon at the top right. There we will see the temperature values that the sensor recently measured as well as the historical data.
Figure 13: Information about RPi CPU Temperature sensor data.
This concludes the work with this sensor. A little later, we will adjust the display of this sensor on the Lovelace panels of the Home Assistant.
● ● ●
Processor Monitoring Sensors.
Now let’s move from the hardware level of monitoring to software. We will be interested in the health parameters of such components of the Home Assistant OS as: Processor, Memory, Disks and Network.
Home Assistant has a built-in special platform called System Monitor with a set of sensors to monitor the local system. System Monitor allows you to monitor CPU usage and temperature, RAM and disk usage, traffic on network interfaces.
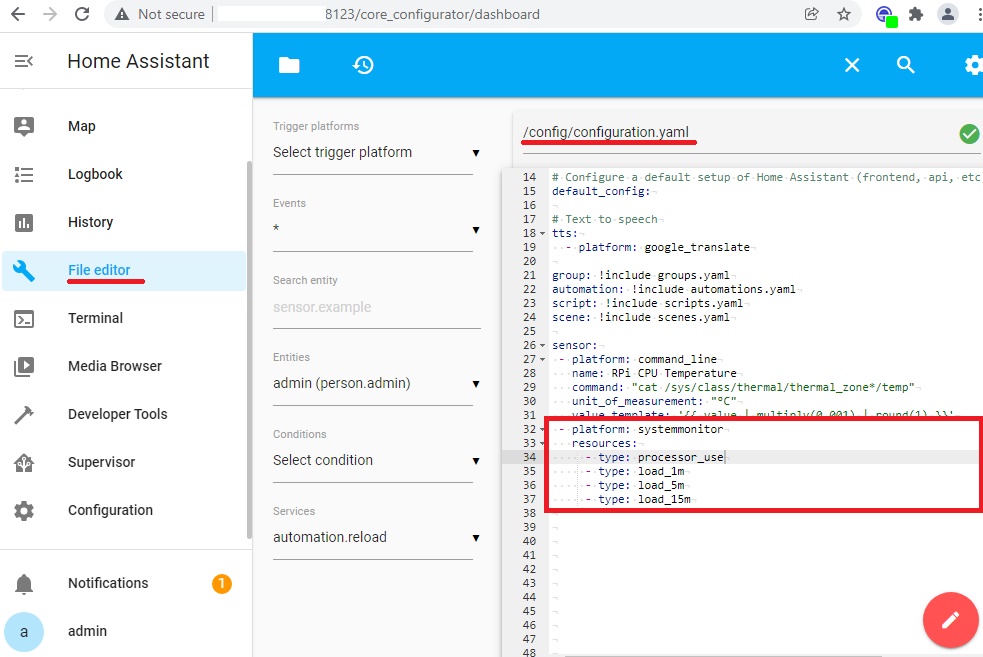
We will not immediately add all possible resource sensors to the monitoring. Let’s do it gradually, and start with CPU load sensors and system load sensors for the last 1 minute, 5 minutes, 15 minutes.
To activate the System Monitor platform and start collecting monitoring data in the configuration.yaml configuration file, add the following code:
Figure 14: We add the activation code of the System Monitor platform to monitor CPU load and system load for the last 1 minute, 5 minutes, 15 minutes.
After adding the parameters, check the configuration and reboot the system, as described above.
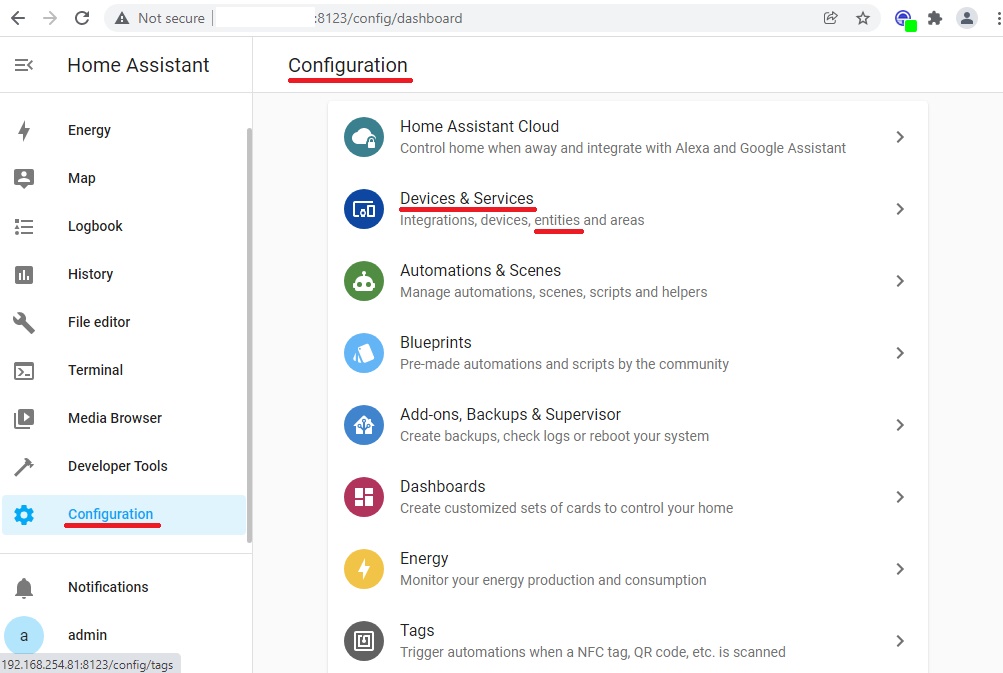
Important: In the Home Assistant version of 2021.12, the design of the Configuration section has been changed:
Figure 15: New design of the Configuration section Home Assistant interface.
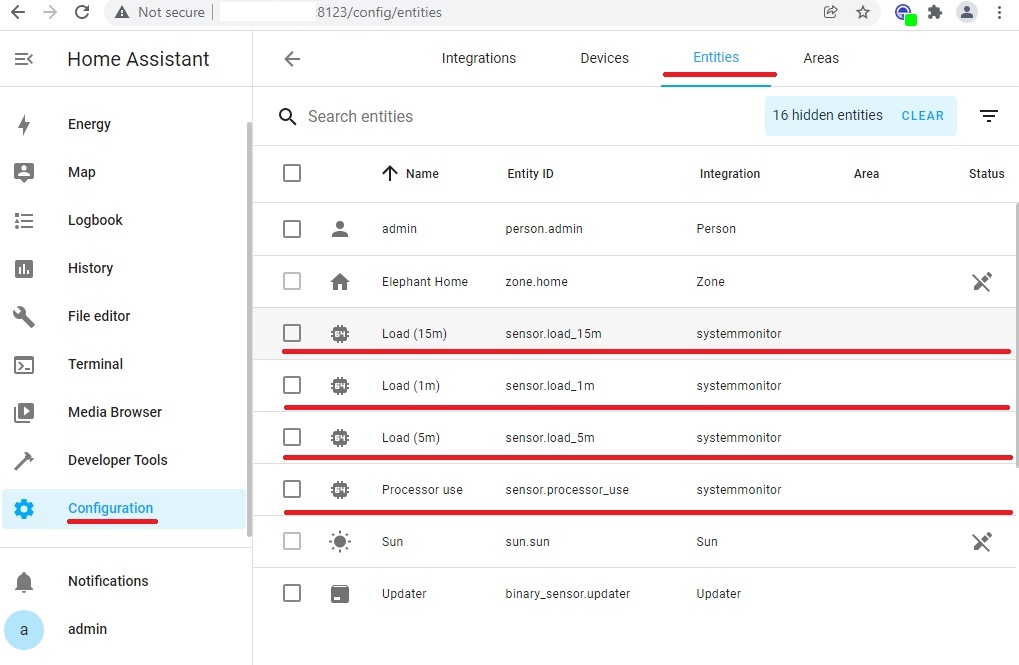
Therefore, to check the operation of the added sensors, go to the already known section of the Configuration menu, Now the section is called Devices and Services, and the name of the Entities tab remains unchanged.
Here we will see recently added sensors:
Figure 16: New added processor load and system load sensors for the last 1 minute, 5 minutes, 15 minutes.
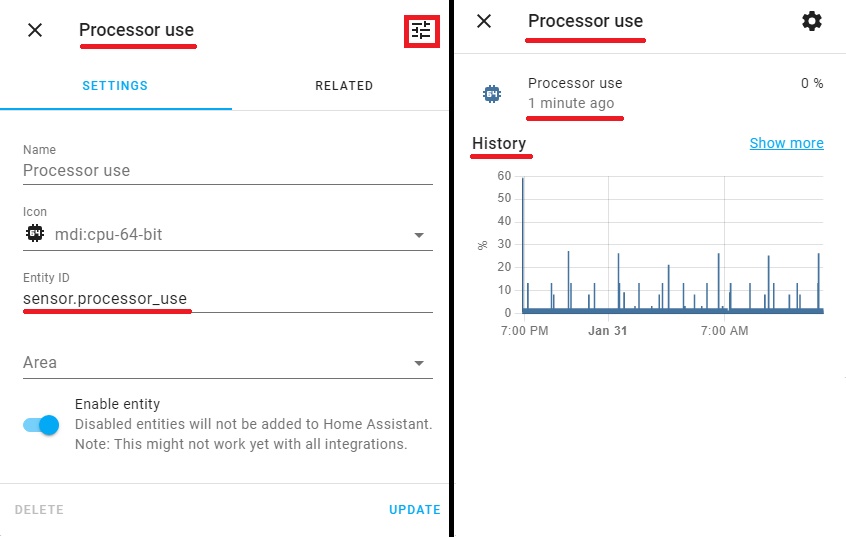
Similar to the above steps, open the Processor Use pop-ups with information about the status of the sensor and the collected data in historical terms.
Figure 17: Information about the status of the Processor Use sensor and the collected data in historical terms.
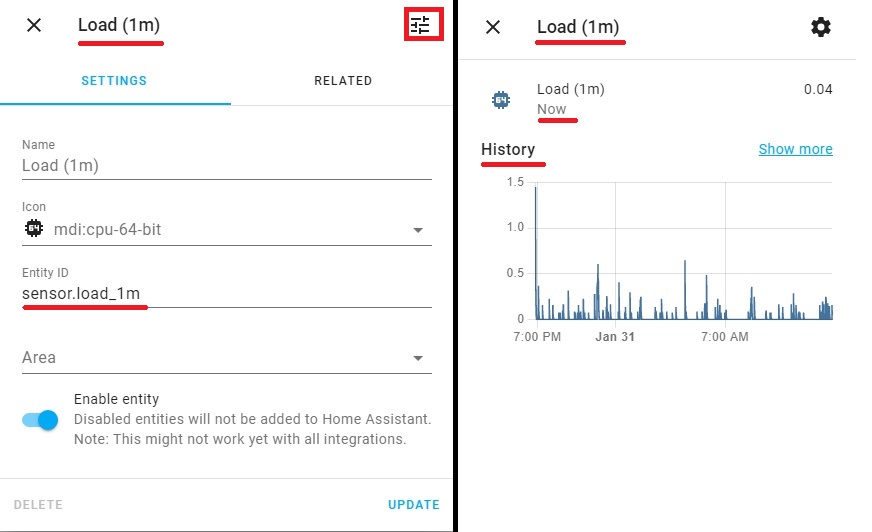
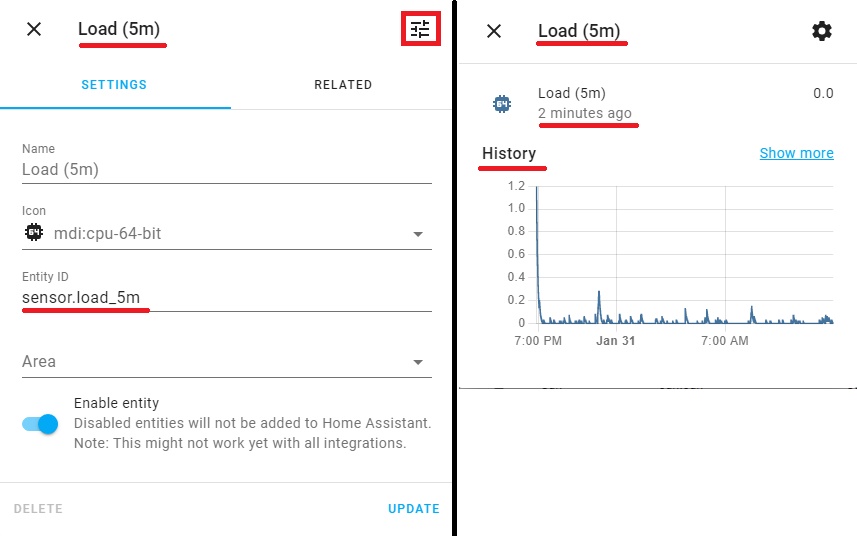
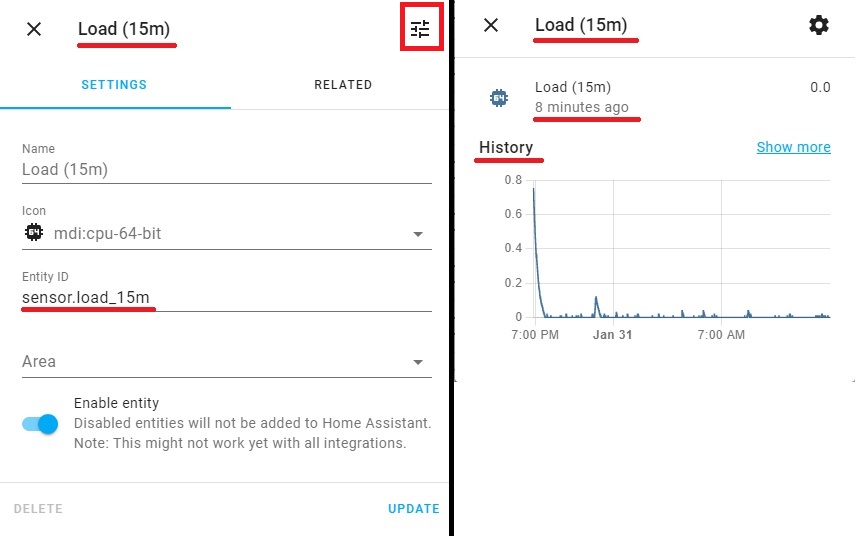
Perform similar steps for Load (1m), Load (5m), Load (15m) sensors.
Figure 18: Information about the status of the Load (1m) sensor and the collected data in historical terms.Figure 19: Information about the status of the Load (5m) sensor and the collected data in historical terms.Figure 20: Information about the status of the Load (15m) sensor and the collected data in historical terms.
This concludes the work with these sensors. A little later, we will adjust the display of these sensors on the Lovelace panels of the Home Assistant.
● ● ●
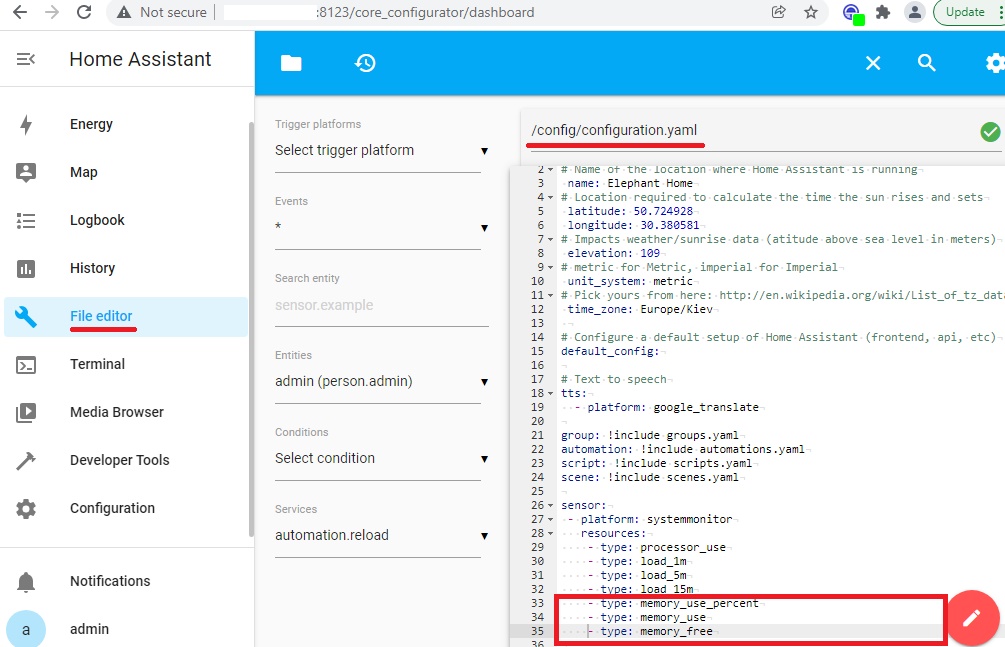
Memory Monitoring Sensors.
Now let’s move on to configuring and testing the memory usage monitoring sensors. Add a few more lines to the code we added above:
Figure 21: Add parameters to monitor usage and free memory capacity in the configuration.yaml file.
After adding the parameters, you should check the configuration again and reboot the system, as described above.
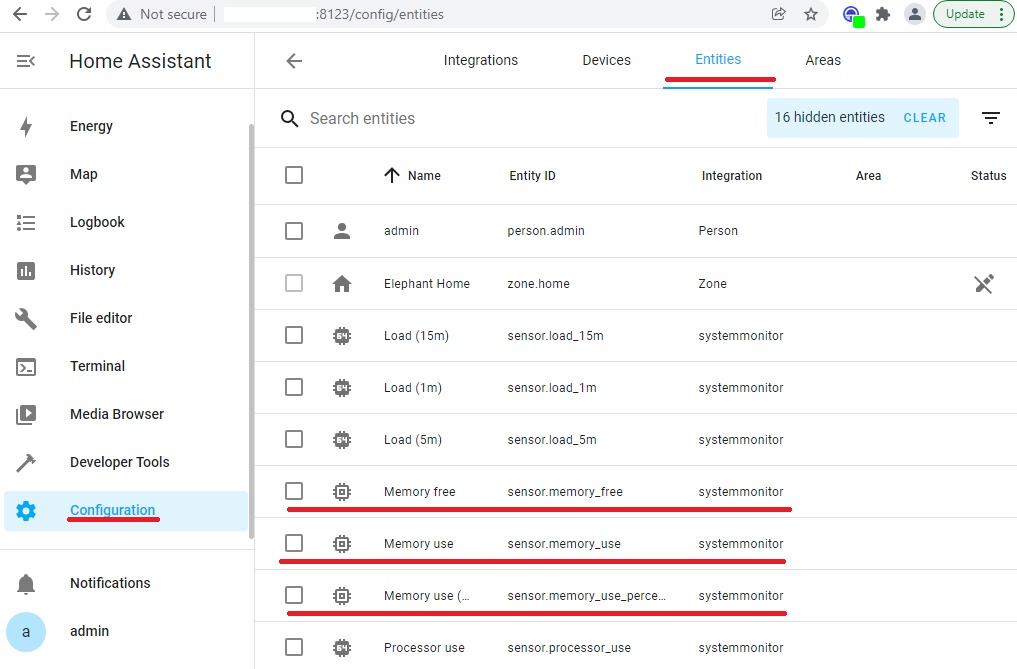
To check the operation of the added sensors, go to the already known section of the Configuration menu, Devices and Services section, Entities tab. Here we will see recently added sensors:
Figure 22: New added sensors to monitor memory usage, percentage and free capacity.
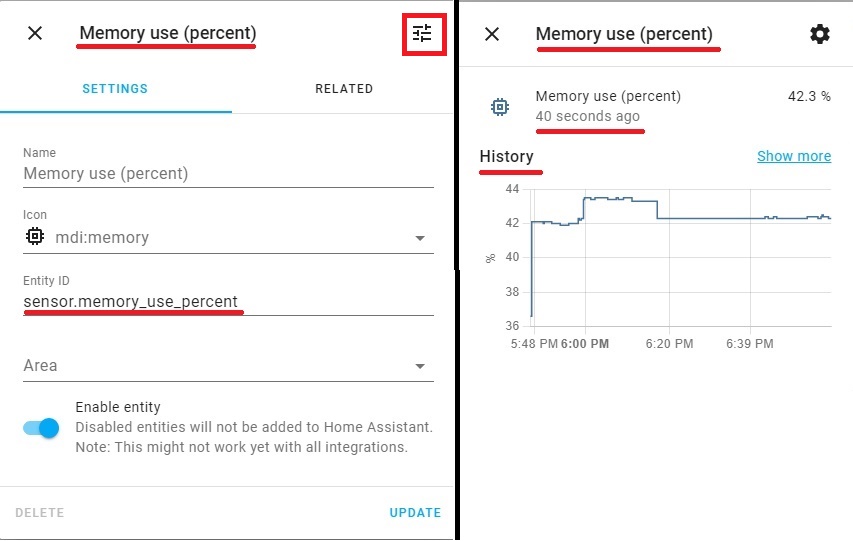
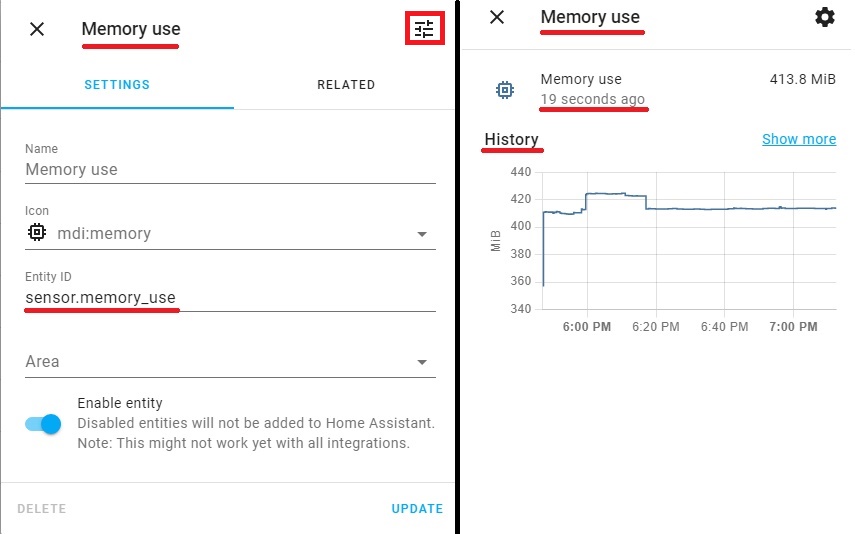
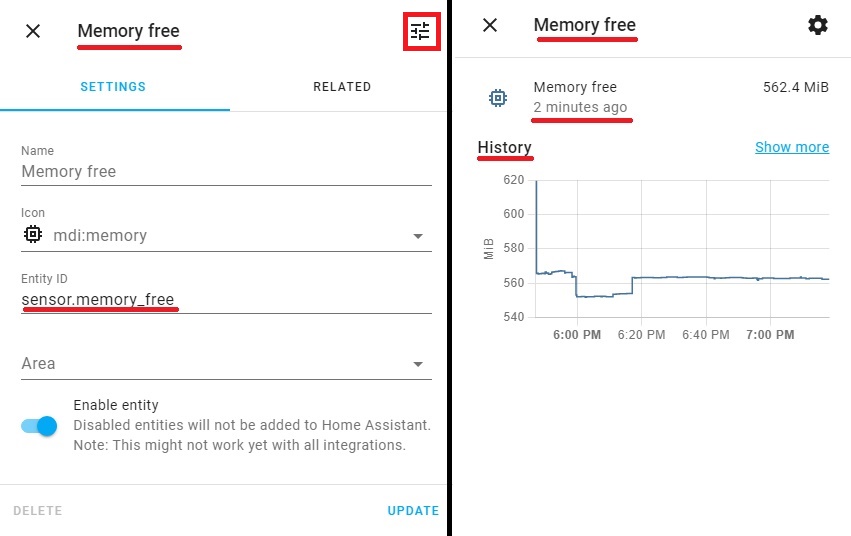
Similar to the above steps, open the “Memory use (persent)”, “Memory use”, “Memory free” pop-ups with information about the status of the sensor and the collected historical data.
Figure 23: Information about the state of the Memory use (persent) sensor and the collected data in historical terms. Figure 24: Information about the state of the Memory use sensor and the collected data in historical terms.Figure 25: Information about the state of the Memory free sensor and the collected data in historical terms.
This will similarly complete the work with these sensors. A little later, we will adjust the display of these sensors on the Lovelace panels of the Home Assistant.
● ● ●
Disk Monitoring Sensors.
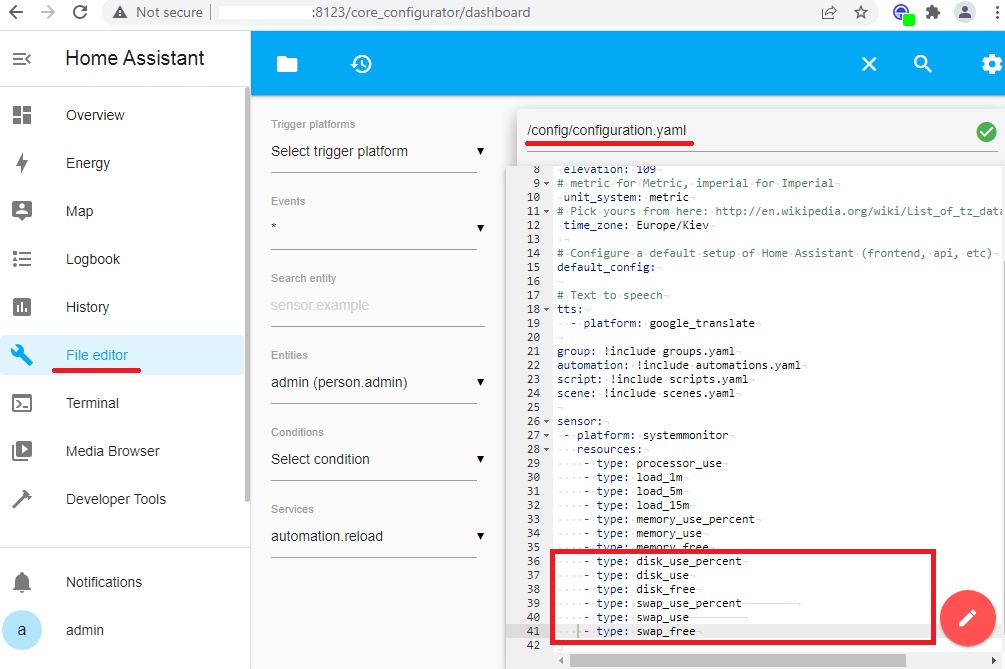
The next step is to configure and test the disk usage and swap file sensors. Add a few more lines to the code we added above:
Figure 26: Add parameters to monitor disk usage and swap file in the configuration.yaml file.
After adding the parameters, you should check the configuration again and reboot the system, as described above.
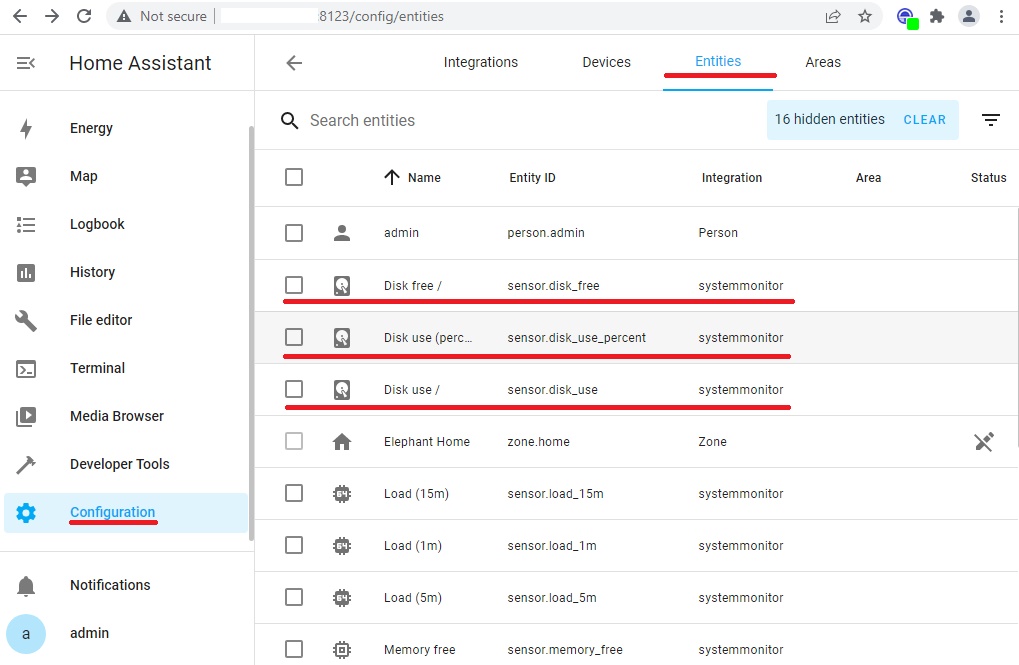
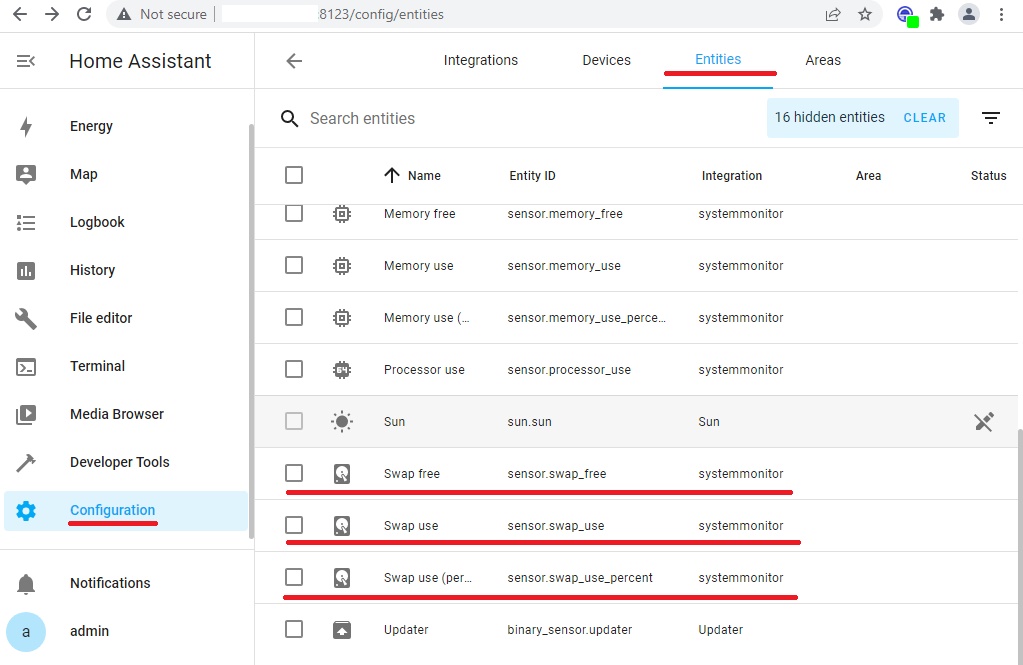
The test is similar to the steps described above: In the Configuration menu, Devices and Services section, on the Entities tab, we will see the recently added sensors:
Figure 27: New added sensors to monitor disk usage, percentage and free capacity.Figure 28: New added sensors to monitor swap file usage, percentage and free capacity.
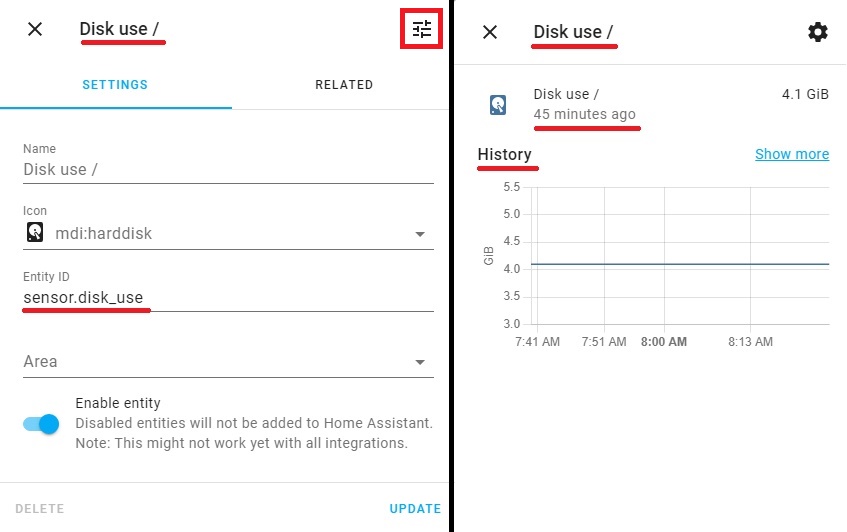
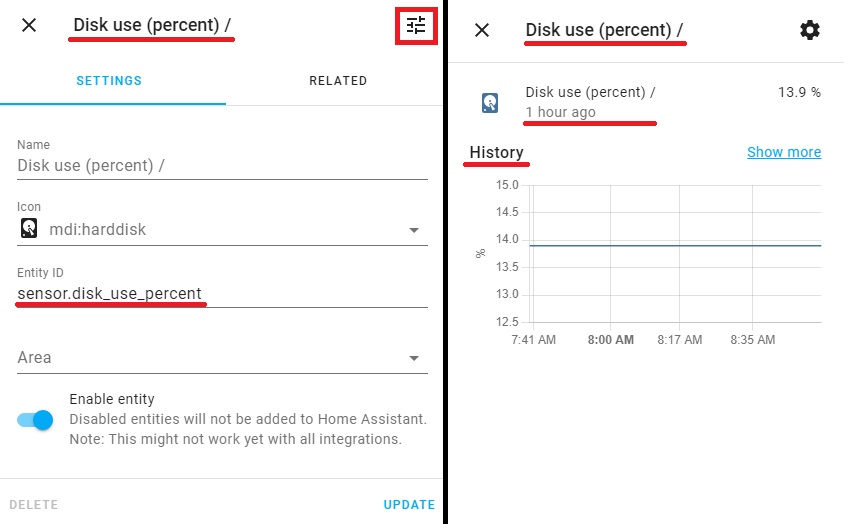
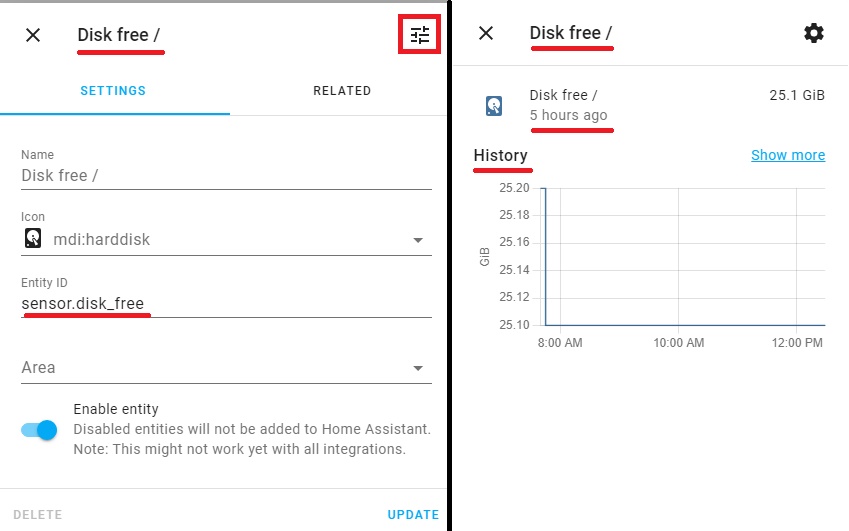
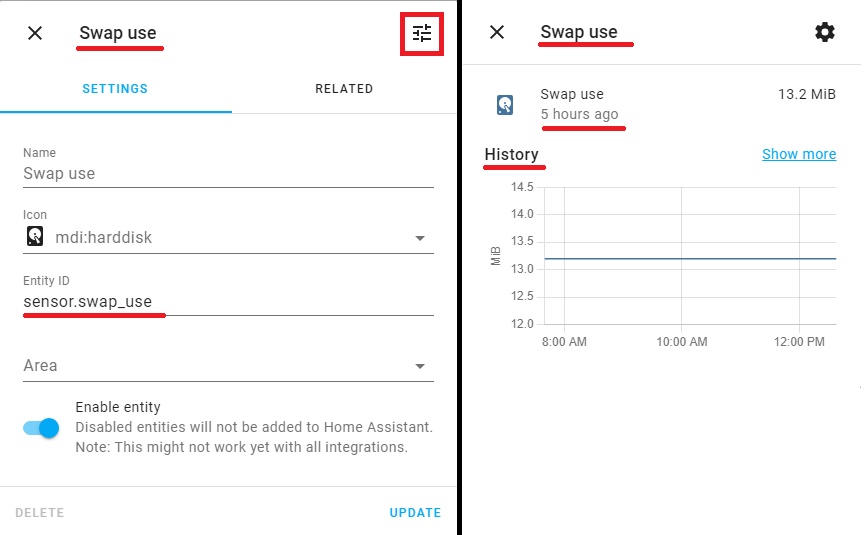
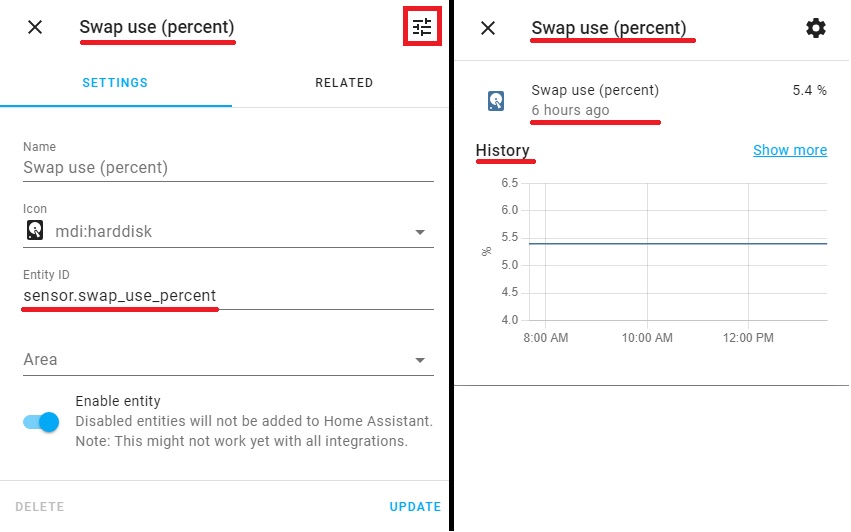
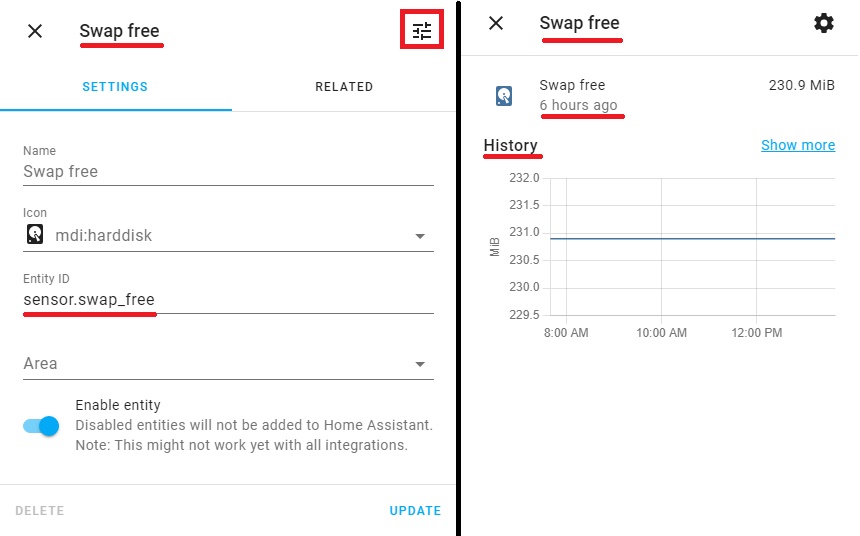
Similar to the above steps, open the “Disk use / “, “Disk use / (percent)“, “Disk free /”, “Swap use“, “Swap use (percent)“, “Swap free” pop-ups with information about the status of the sensor and the collected data in historical terms.
Figure 29: Information about the state of the Disk use / sensor and the collected data in historical terms.Figure 30: Information about the state of the Disk use / (percent) sensor and the collected data in historical terms.Figure 31: Information about the state of the Disk free / sensor and the collected data in historical terms.Figure 32: Information about the state of the Swap use sensor and the collected data in historical terms.Figure 33: Information about the state of the Swap use (percent) sensor and the collected data in historical terms.Figure 34: Information about the state of the Swap free sensor and the collected data in historical terms.
This will similarly complete the work with these sensors. A little later, we will adjust the display of these sensors on the Lovelace panels of the Home Assistant.
● ● ●
Network Monitoring Sensors.
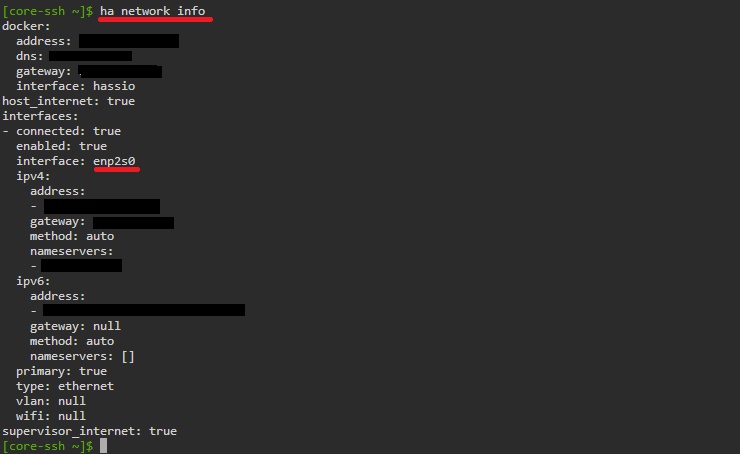
Finally, the last group of sensors in the System Monitor platform is network monitoring sensors. But before adding the code to the configuration file, you need to find out the required parameter – the alias of the network interface.
This can be done with the following command:
ha network info
Figure 35: We get information about the alias of the network interface.
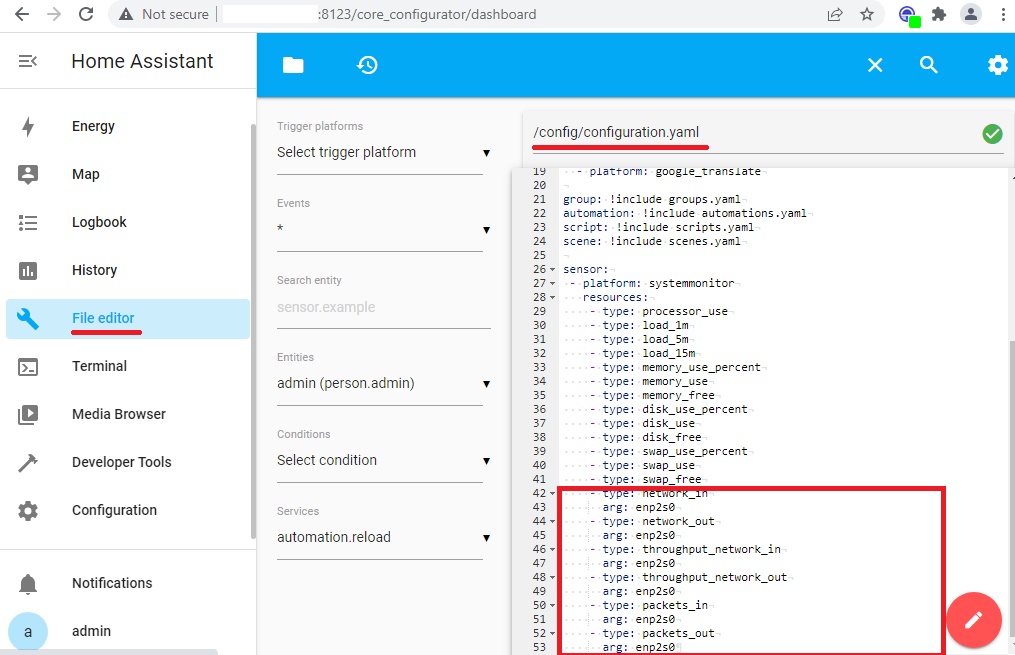
And now, to the code we added above, we add a few more lines, using the alias just clarified as an argument:
Figure 36: Add parameters to monitor network interface in the configuration.yaml file.
After adding the parameters, you should check the configuration again and reboot the system, as described above.
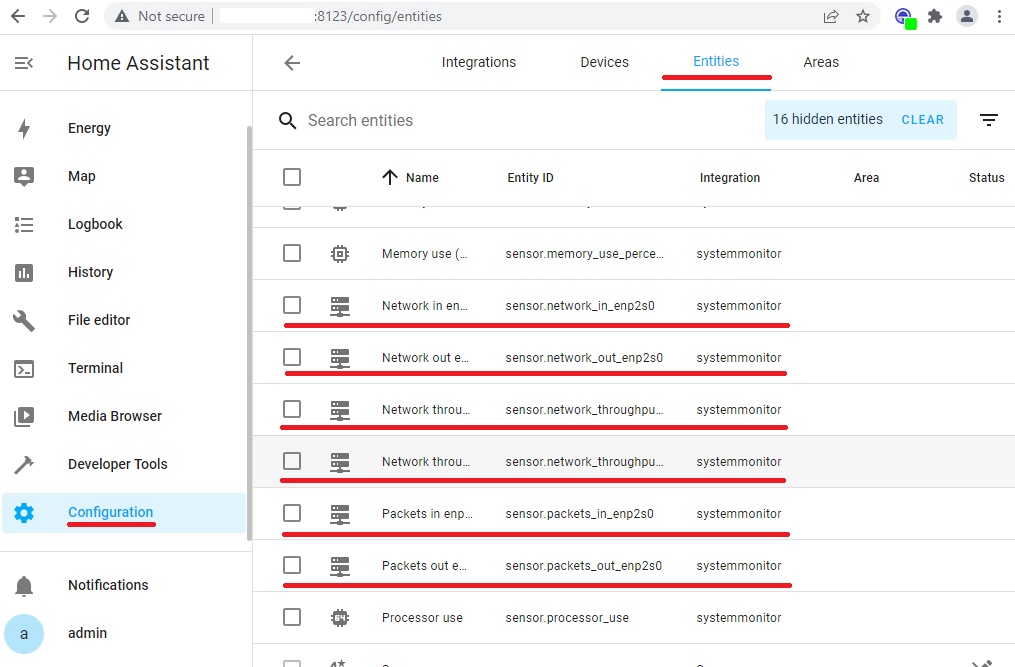
The test is similar to the steps described above: In the Configuration menu, Devices and Services section, on the Entities tab, we will see the recently added sensors:
Figure 37: New added sensors to monitor Network interface of Home Assistant OS.
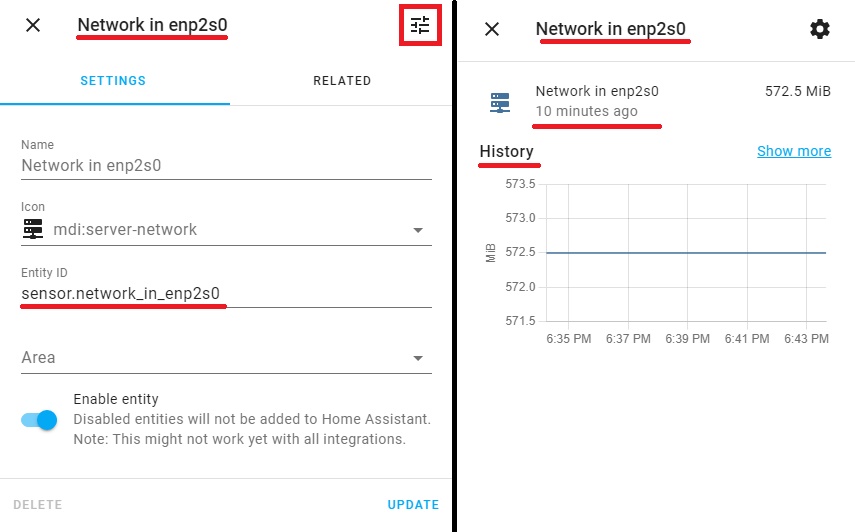
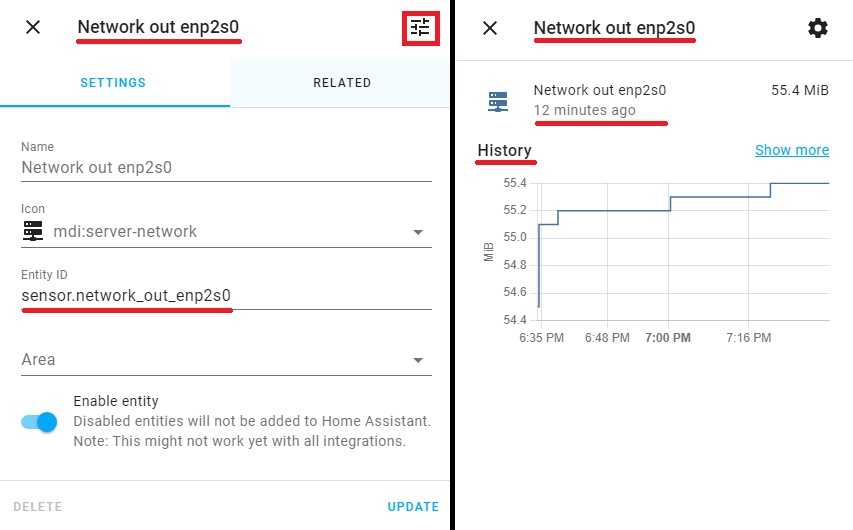
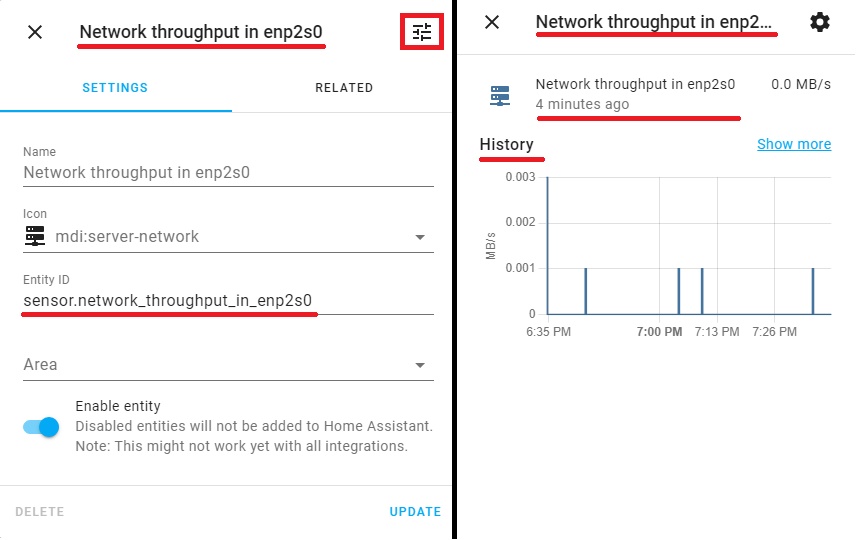
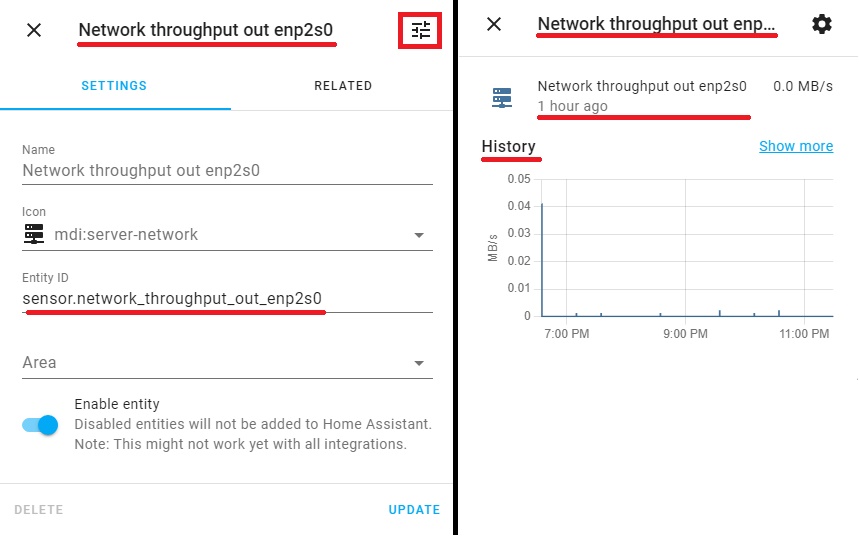
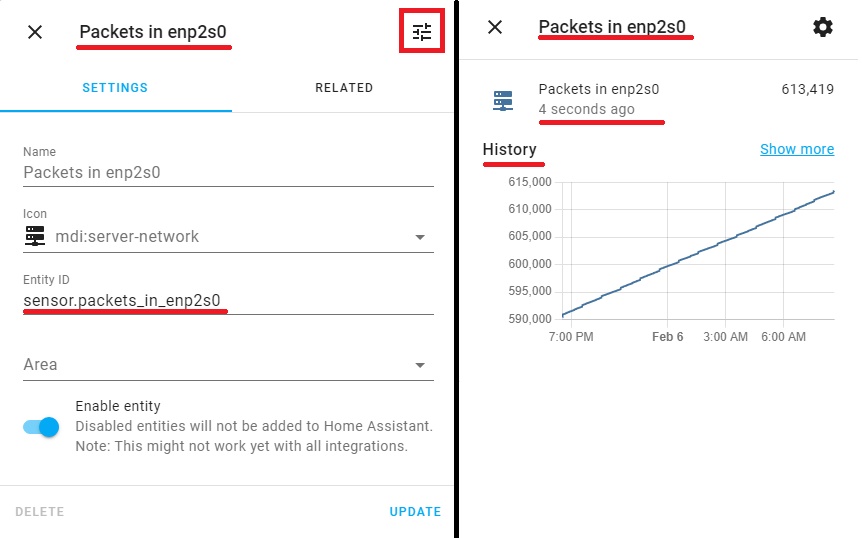
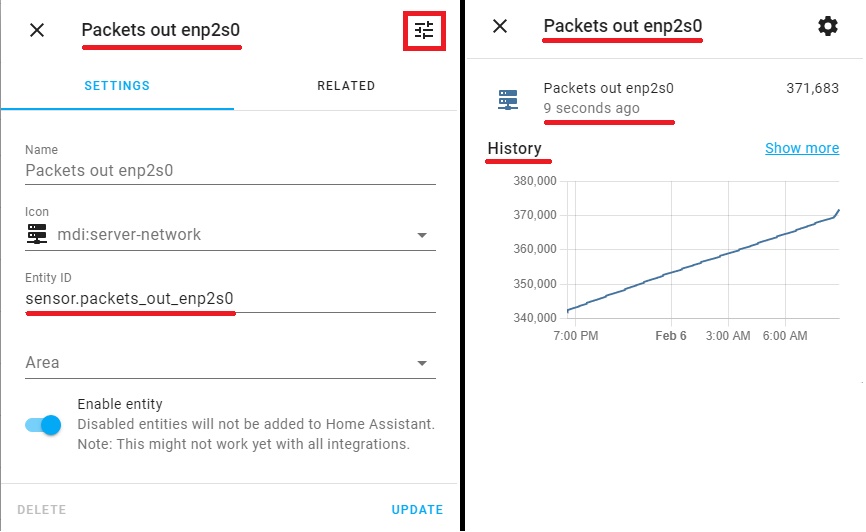
Similar to the above steps, open the “Network in enp2s0”, “Network out enp2s0”, “Network throughput in enp2s0”, “Network throughput out enp2s0“, “Packets in enp2s0“, “Packets out enp2s0” pop-ups with information about the status of the sensor and the collected data in historical terms.
Figure 38: Information about the state of the Network in enp2s0 sensor and the collected data in historical terms.Figure 39: Information about the state of the Network out enp2s0 sensor and the collected data in historical terms.Figure 40: Information about the state of the Network throughput in enp2s0 sensor and the collected data in historical terms. Figure 41: Information about the state of the Network throughput out enp2s0 sensor and the collected data in historical terms. Figure 42: Information about the state of the Packets in enp2s0 sensor and the collected data in historical terms. Figure 43: Information about the state of the Packets out enp2s0 sensor and the collected data in historical terms.
This will similarly complete the work with System Monitor sensors. We have considered the full range of sensors on this platform. A little later we will adjust the display of all sensors on the lovelace panels of the Home Assistant. And now let’s move on to monitoring another important component of Home Assistant.
Home Assistant Database Size monitoring.
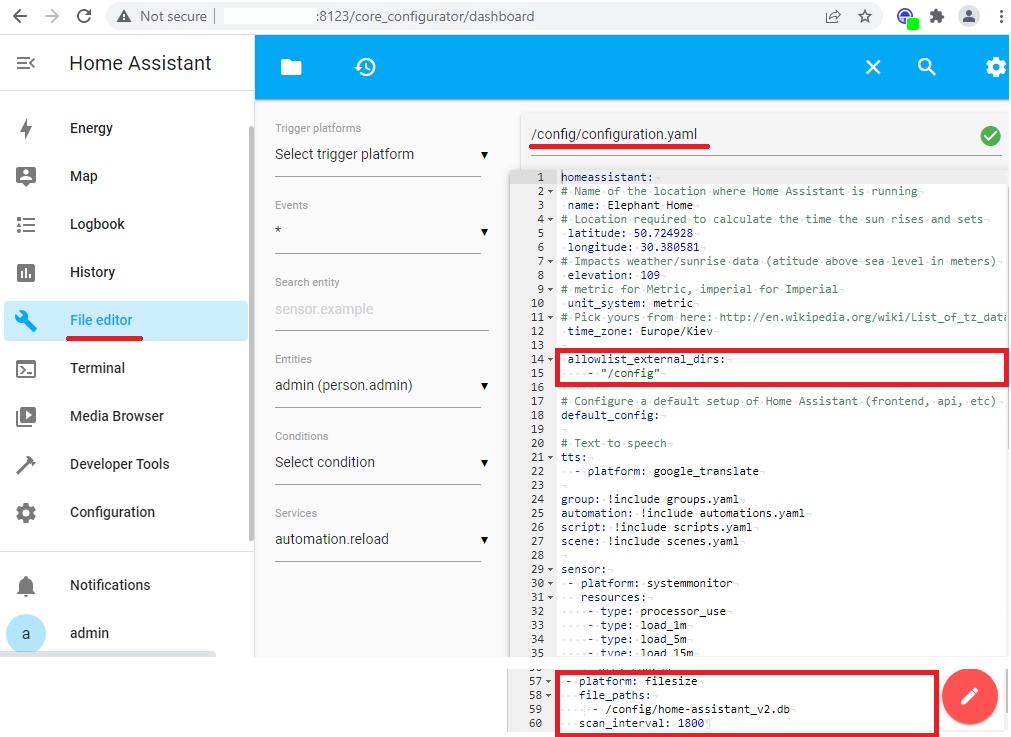
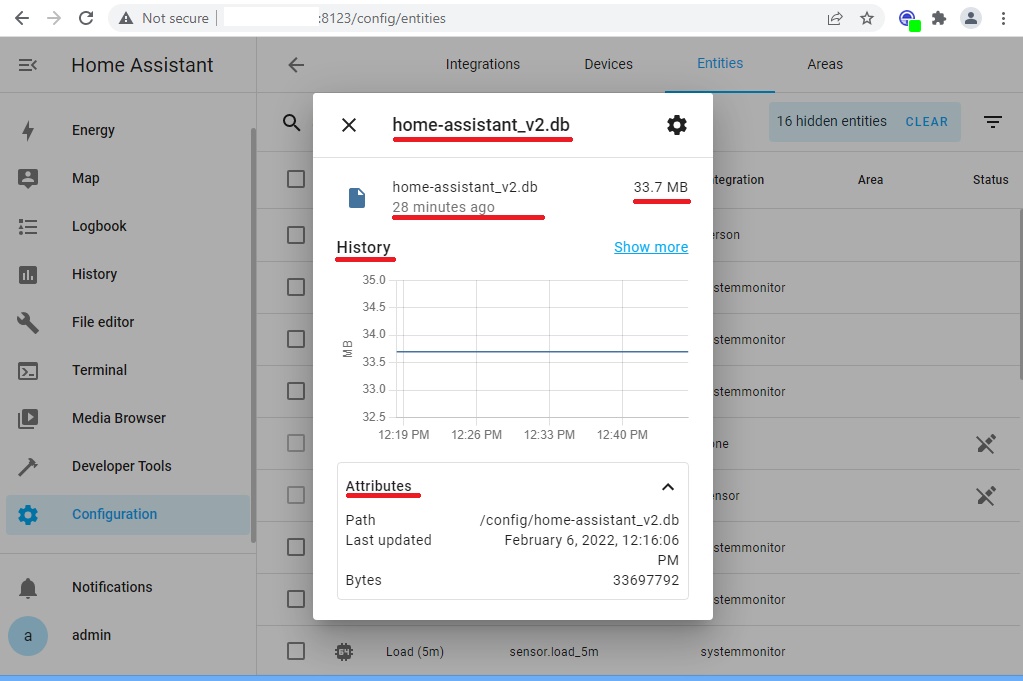
Monitoring the size of the Home Assistant database is very important. The database will expand during long-term use and after adding a significant amount of integration. The larger the database, the more SQLite read and write operations, which means that Home Assistant slows down. Extreme I / O will increase the load on the SD card, which means their accelerated degradation and failure.
In the default configuration, Home Assistant keeps a history of all events and states for all objects for approximately 10 days. This data provides the functions of History and Logbook. The data itself is stored using the Recorder integration, which by default writes it to the SQLite database file located in /config/home-assistant_v2.db.
The topic of database tuning is beyond the scope of this publication, but I promise that we will return to this issue later. For now, we will focus only on the process of monitoring the size of the database.
Figure 44: Add parameters to monitor Home Assistant Database Size in the configuration.yaml file.
This sensor will be updated every half minute. Because each state change will add a couple of lines to the recorder’s database, we reduce the refresh rate with the scan_interval parameter.
After adding the parameters, you should check the configuration again. But to use them, this time you need to restart the host. This can be done with the following command:
ha host reboot
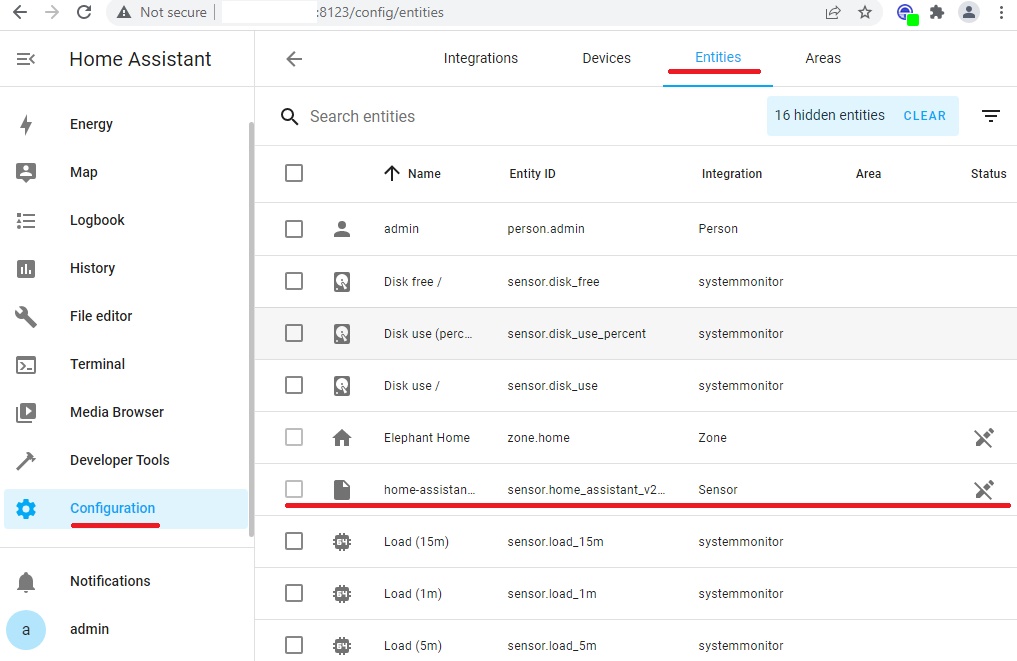
After rebooting, perform the verification in the same way as above: In the Configuration menu, Devices and Services section, on the Entities tab, we will see the recently added sensor:
Figure 45: New added sensor to monitor the size of the Home Assistant database.
Select this item, and immediately open another pop-up home-assistant_v2.db using the icon at the top right. There we will see the size of the Home Assistant database, which recently measured the sensor as well as historical data. You can see the attributes of the sensor:
Figure 46: Information about the Home Assistant Database Size monitoring sensor data.
This will similarly complete the work with the Home Assistant database size monitoring sensor. A little later, we will adjust the display of this sensor on the Lovelace panels of the Home Assistant.
Internet connection monitoring.
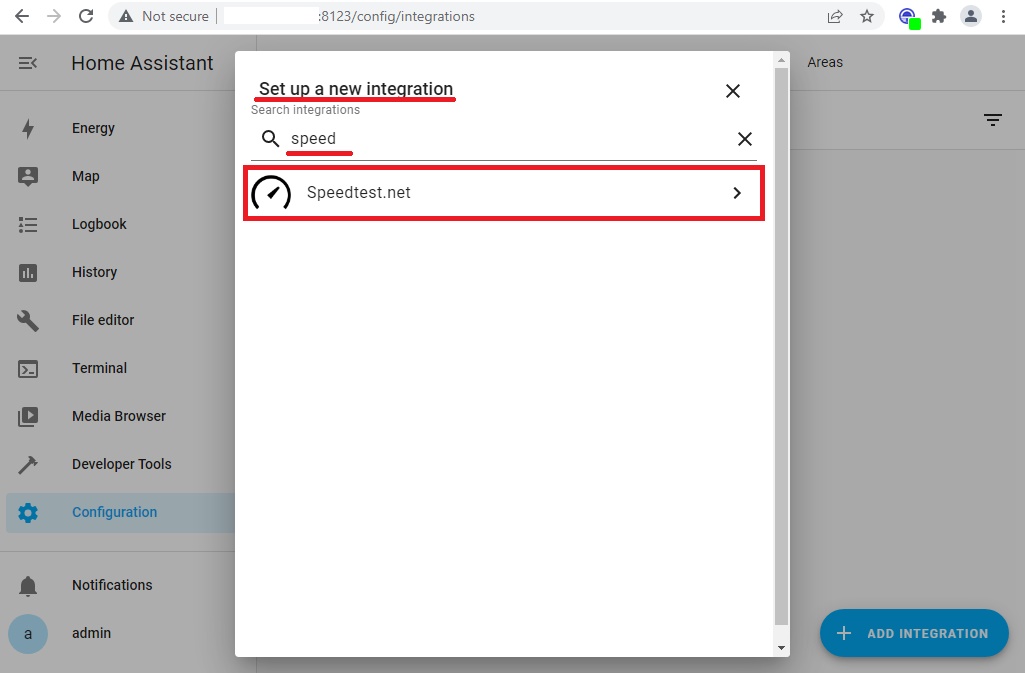
Another important parameter for constant monitoring is the quality of the Internet connection. It’s simple. Home Assistant has the ability to control these parameters using the integration component of Speedtest.net.
It is very easy to install. Go to the already familiar menu Configuration, section Devices and Services, Integration tab. We add a new Integration: + Add Integration. In the popup window Set up a new integration in the search field enter speedtest.net:
Figure 47: Installation of the integration component Speedtest.net.
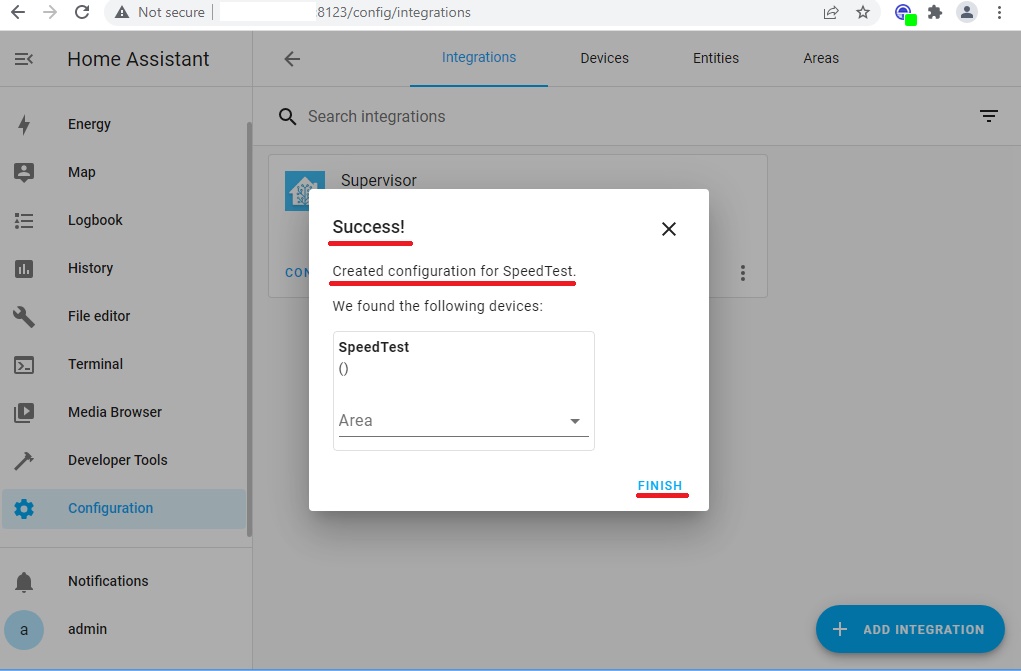
After confirmation of the installation in a short period of time we will receive a message about the successful operation.
Figure 48: The integration component of Speedtest.net has been successfully installed.
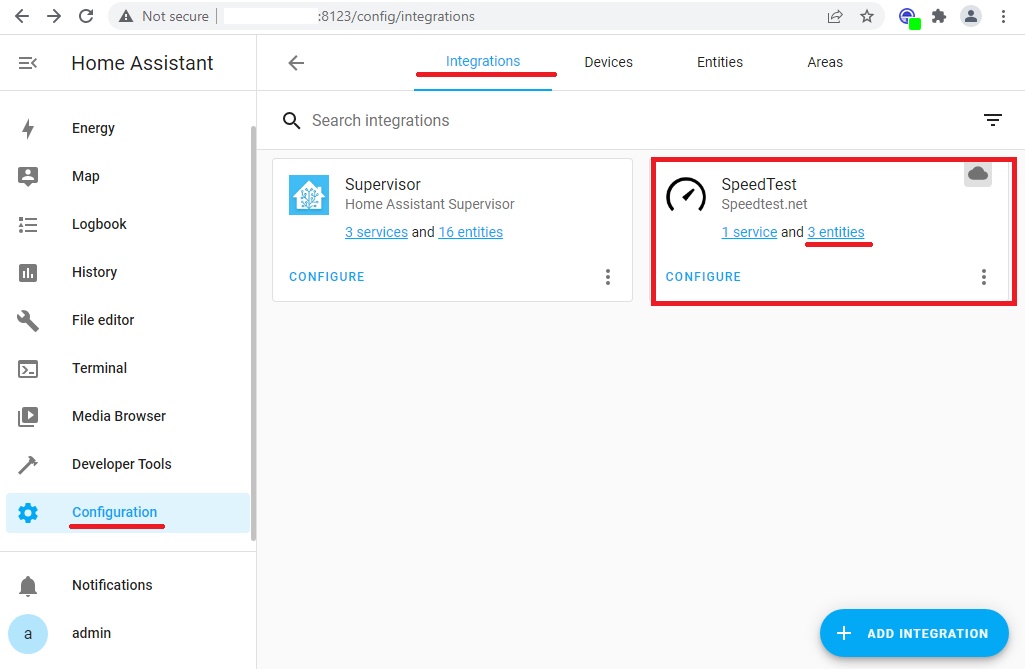
After the successful installation of the speedtest.net integration component, we will see it in the list.
Figure 49: The integration component of speedtest.net is in the list of installed integrations.
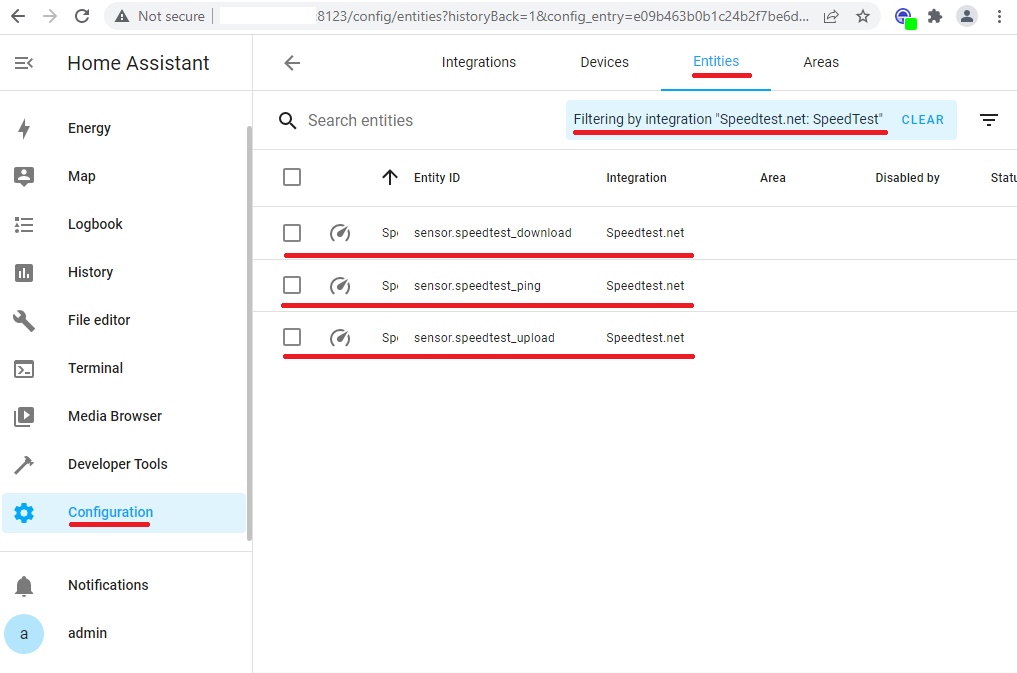
Choose the link 3 entities. And we will see the filtered three sensors.
Figure 50: List of sensors of the integration component of Speedtest.net.
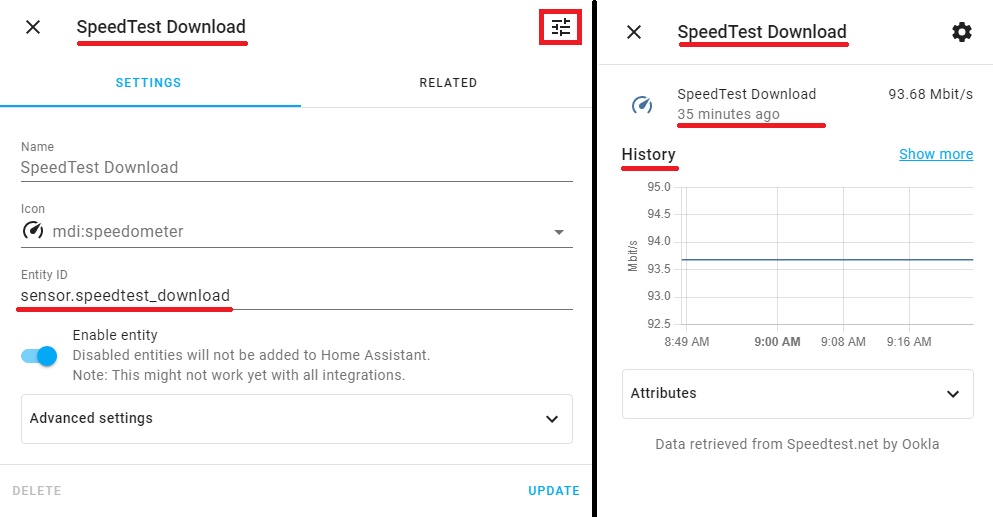
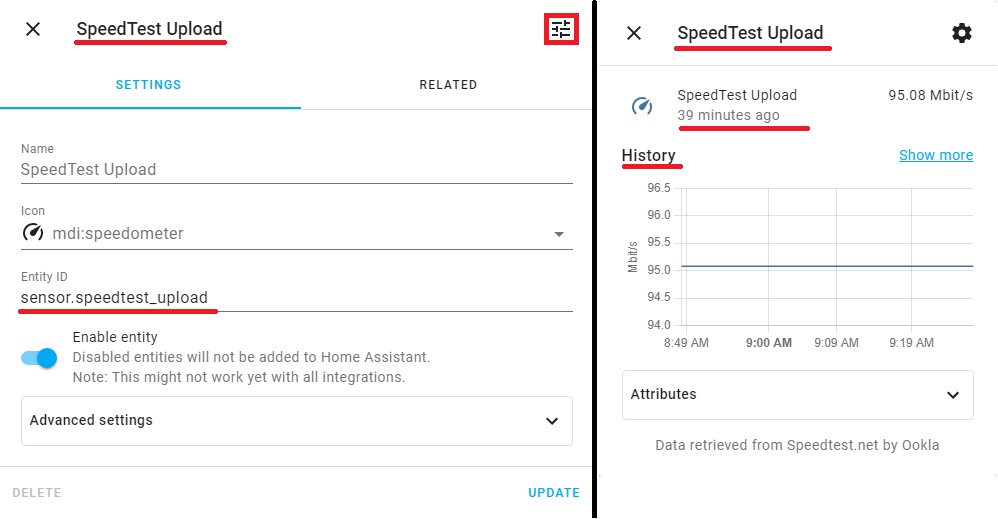
Similar to the steps described above in this article, we will open pop-ups “SpeedTest Ping“, “SpeedTest Download“, “SpeedTest Upload” with information about the status of the sensor and the collected data in historical terms.
Figure 51: Information about the state of the SpeedTest Ping sensor and the collected data in historical terms. Figure 52: Information about the state of the SpeedTest Download sensor and the collected data in historical terms. Figure 53: Information about the state of the SpeedTest Upload sensor and the collected data in historical terms.
This will similarly complete the work with the monitoring sensors of the Internet connection. A little later, we will adjust the display of these sensors on the lovelace panels of the Home Assistant.
Uninterruptible power supply monitoring.
The operation of smart home algorithms primarily depends on a reliable power supply. Our Home Assistant on the Raspberry Pi platform will be connected to the uninterruptible power supply. Therefore, our next step is to set up monitoring of this device.
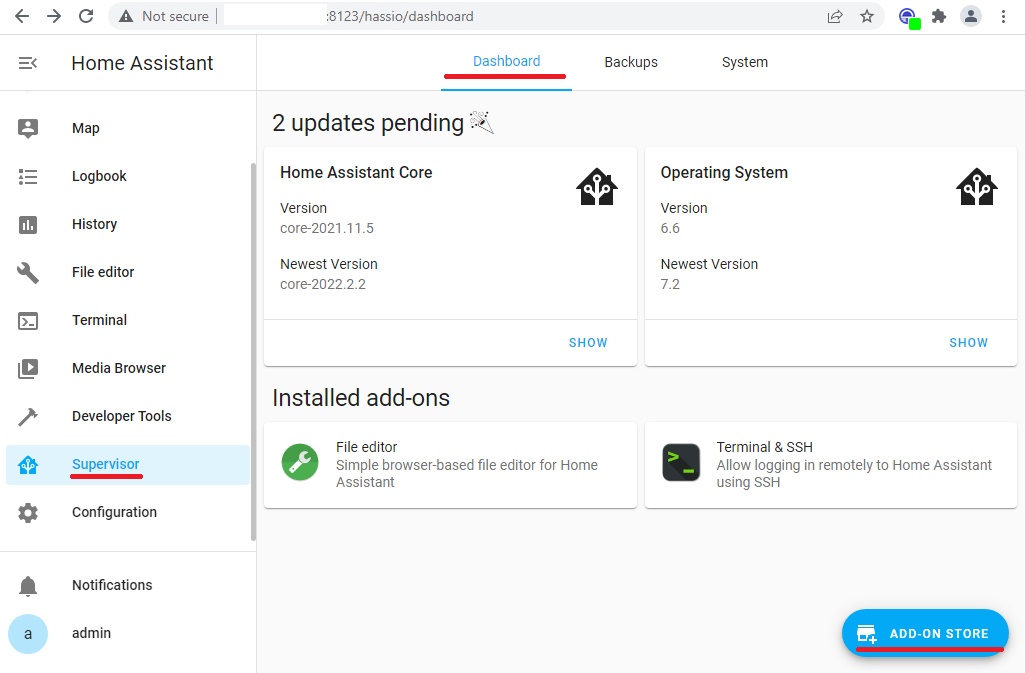
First, let’s add the Network UPS Tools integration package. To do this, in the Supervisor menu, Dashboard tab, select Add-On Store:
Figure 54: We begin the stage of adding and configuring the integration component Network UPS Tools.
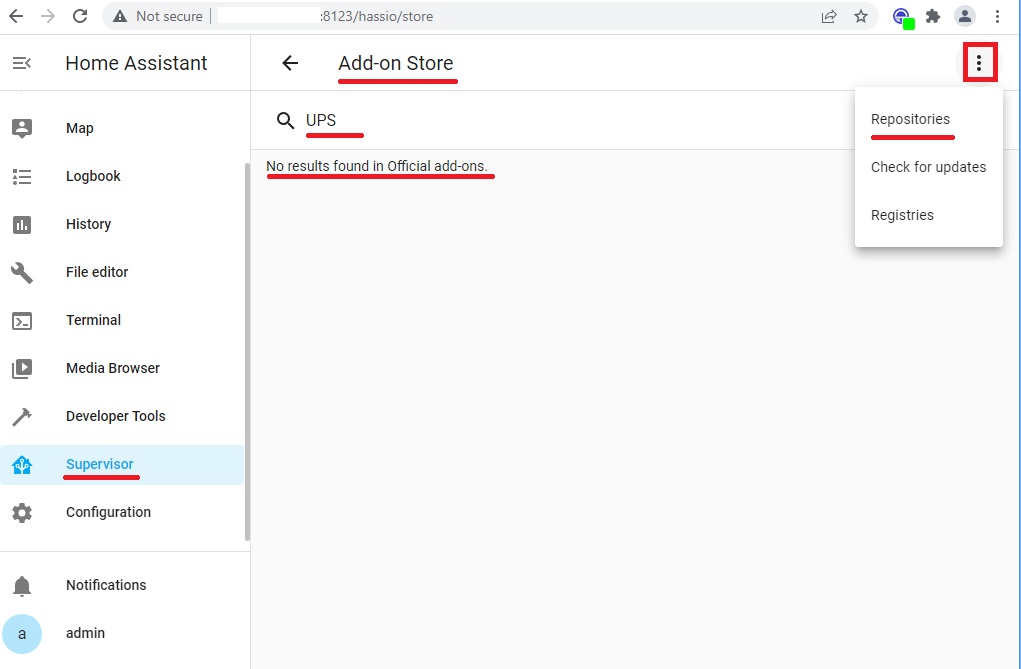
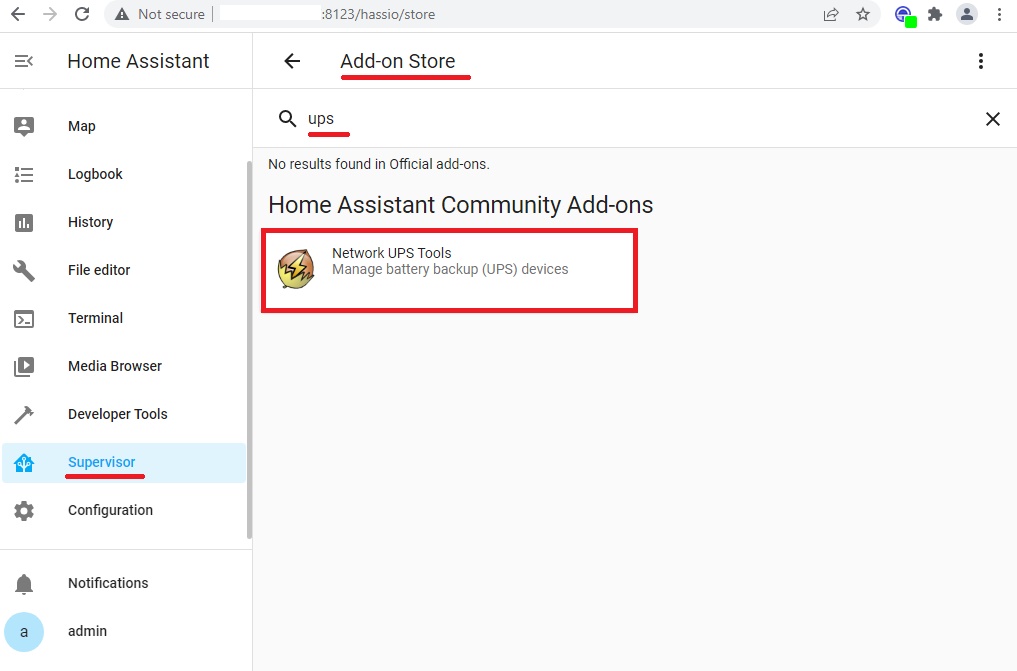
In the search field, enter the UPS:
Figure 55: Search for the integration component Network UPS Tools. No results found in Official add-ons.
Important: If the search for Network UPS Tools did not return any results, it means that there are no official components. And in the repository community, the search was not performed in the absence of the repository address parameter.
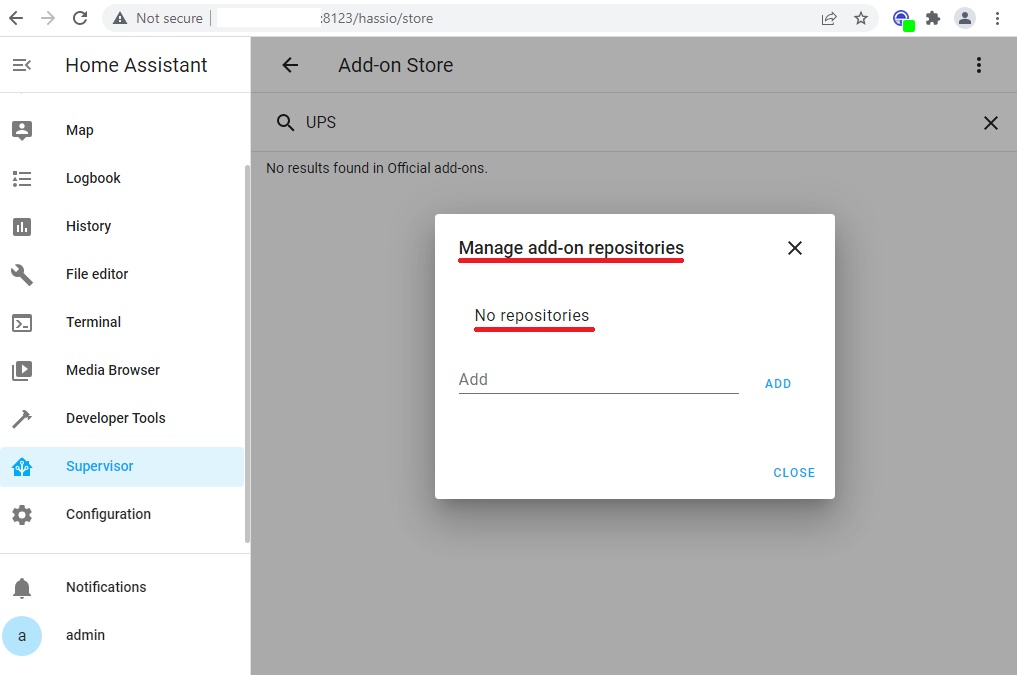
Let’s check this assumption: Call the additional menu by selecting the three-dot icon at the top right of the page. Select Repositories. Manage add-on repositories pop-up window opens:
Figure 56: There are no registered Addresses of the repository of additional integration components.
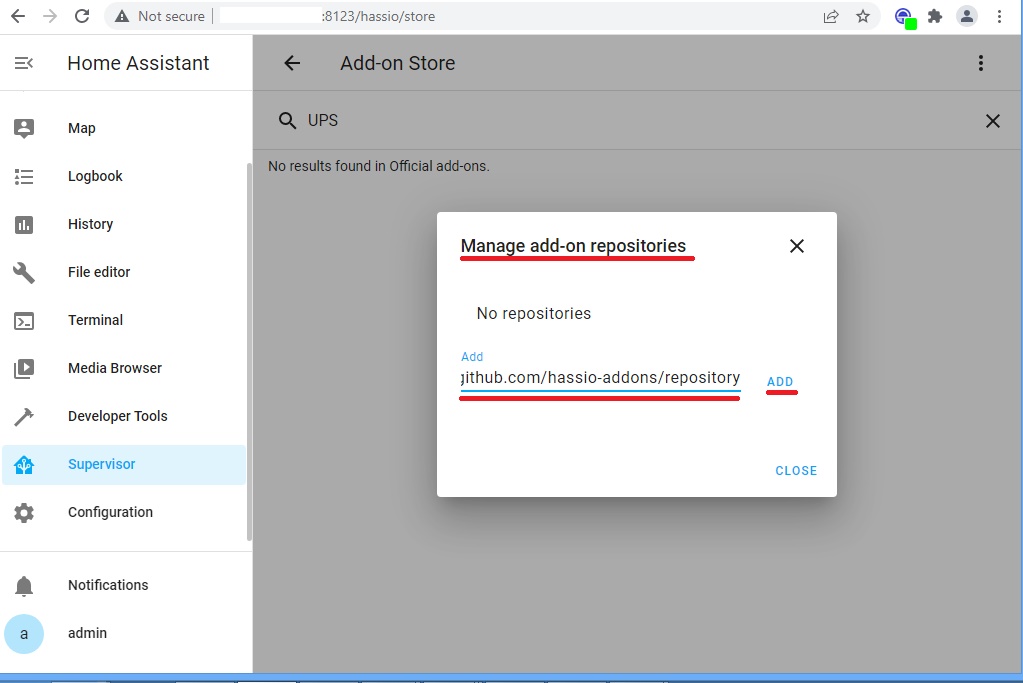
The assumption of the absence of a repository address is true. Therefore, the following address should be added: https://github.com/hassio-addons/repository.
Figure 57: We add the address of the repository of additional integration components Home Assistant. Figure 58: The result of successfully adding the address of the repository of additional integration components Home Assistant.
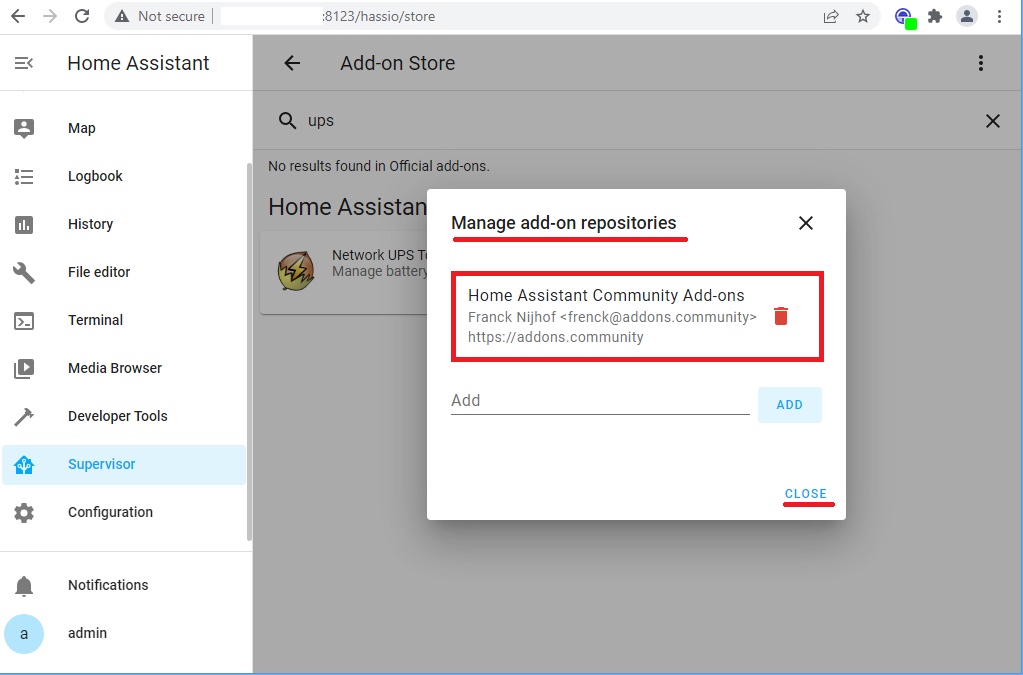
Immediately after adding the above parameter, the Network UPS Tools component we need appeared in the search results:
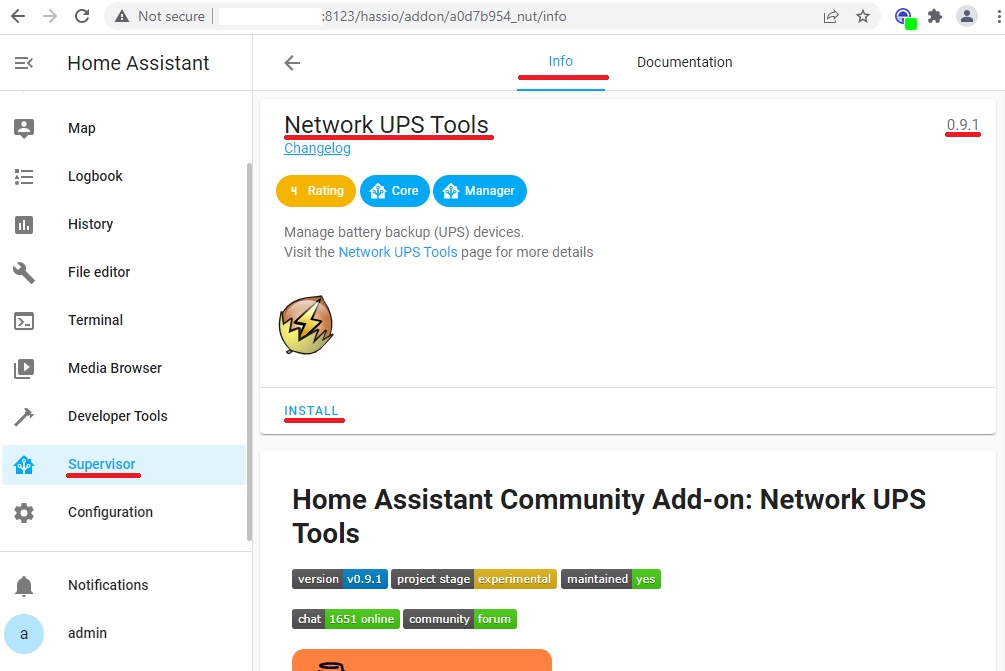
Figure 59: Successful Search Component Integration Network UPS Tools among the repository of community Add-ons.
Next, on the Info tab, we can read current information about this component, version, and if necessary, go to the link to the page of project developers. Choose Install:
Figure 60: Start installing Network UPS Tools.
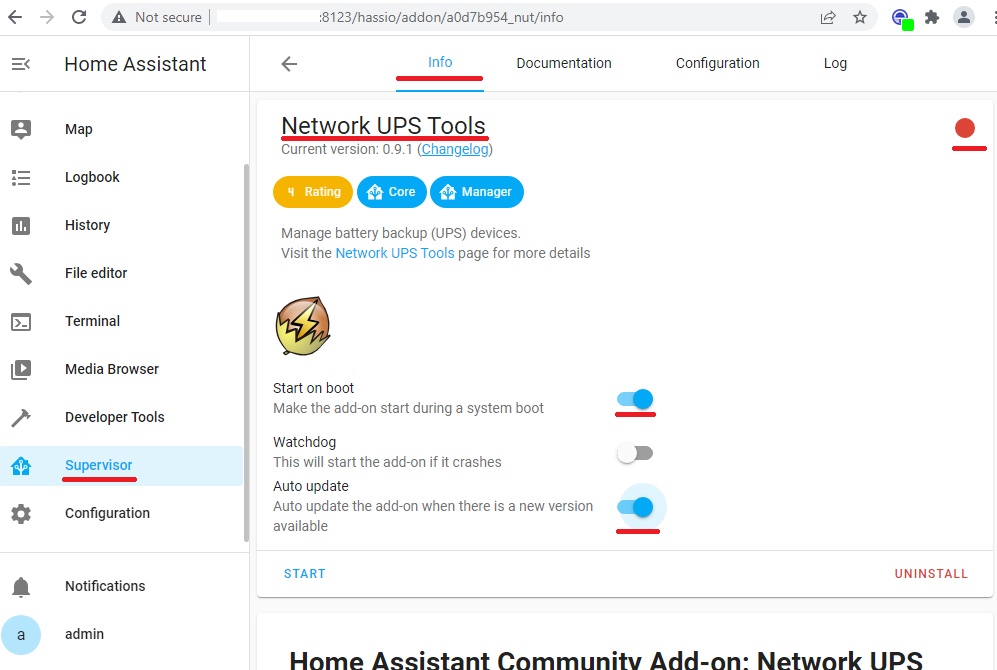
Next, check the status of the Start on boot and Auto update options. They must be turned on. A red indicator at the top right of the page indicates that the component is not running. But it’s too early to start.
Figure 61: Component installation was successful. We check the options Start on boot and Auto update. They must be turned on.
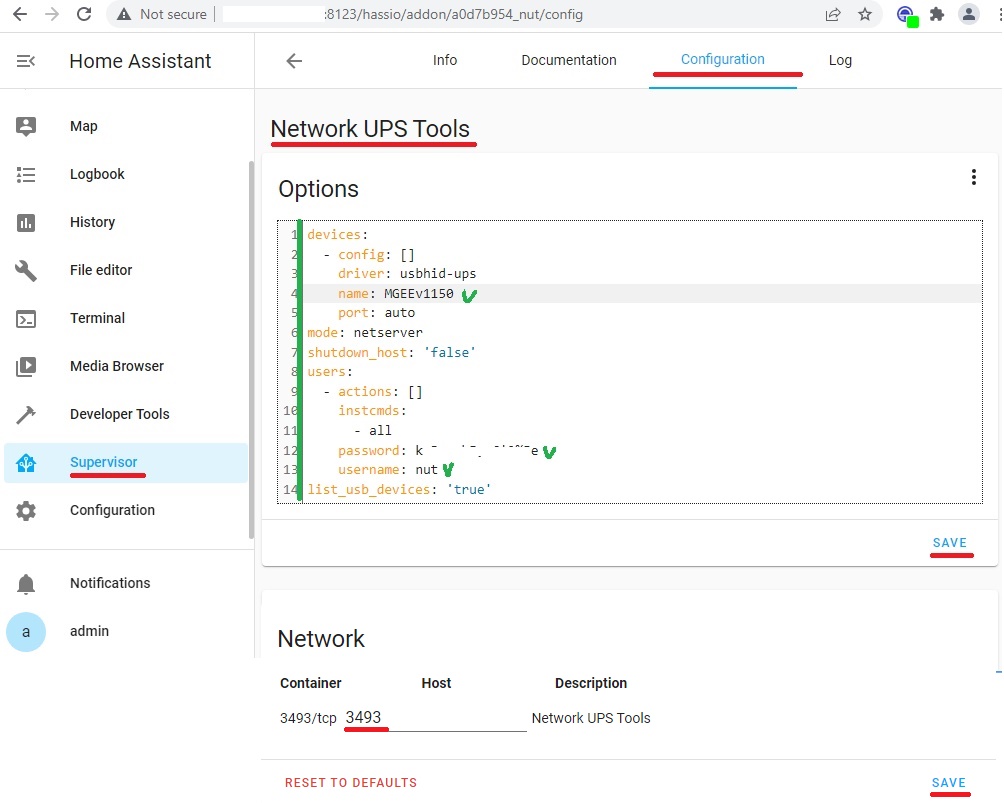
Next you need to configure the settings of this application. To do this, go to the Configuration tab and add the following code in the Options section:
Figure 62: Add the configuration code of the Network UPS Tools Add-on and save the settings.
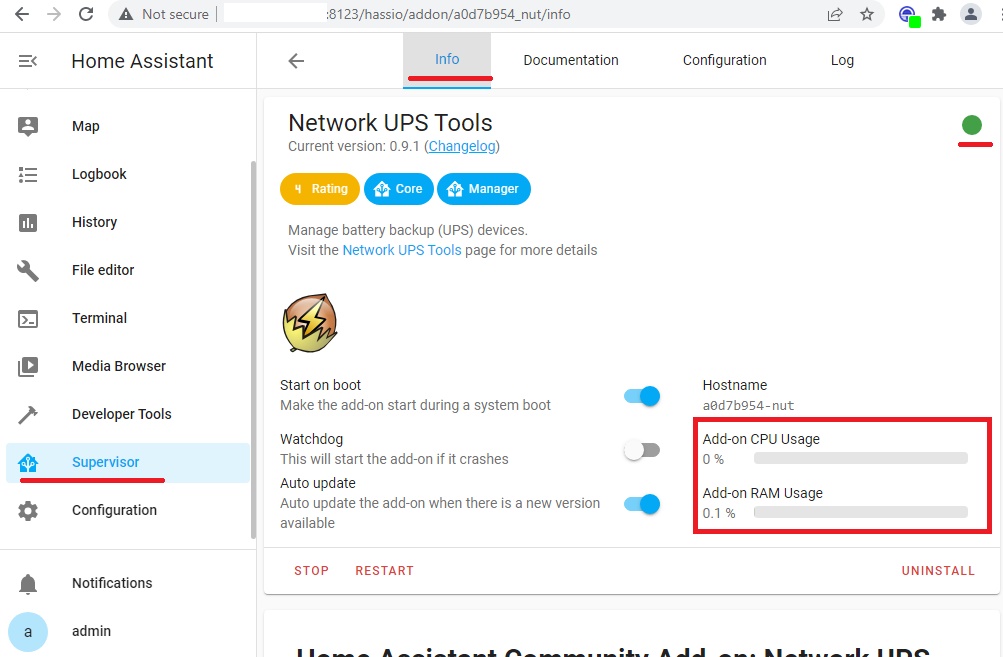
We save the settings in the Options section. And in the network section, specify the host port on which data will be exchanged between the Client and the Network UPS Tools server. Save the settings in the Network section. And start the component. If all is well, a green indicator will appear at the top right of the page and at the bottom right indicators of CPU and memory usage by this component.
Figure 63: Successful start of the Network UPS Tools Add-on.
This is the end of the work on setting up the so-called Network UPS Tools server part, but that’s not all. That’s only half the job. You still need to configure the client part so that the Home Assistant can receive data.
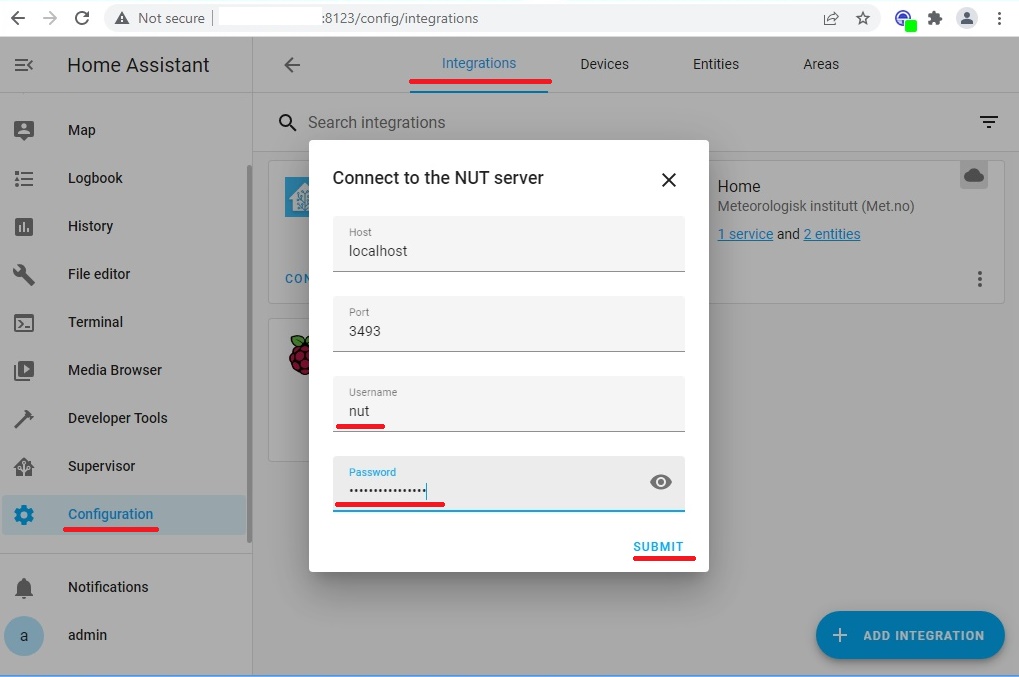
To do this, we need to add the appropriate integration: Network UPS Tools (NUT). This can be done similarly to the steps described above (for example in the section with SpeedTest.net).
Go to the already familiar menu Configuration, section Devices and Services, Integration tab. We add a new Integration: + Add Integration. In the popup window Set up a new integration in the search field, enter the ups:
Figure 64: Search for the Network UPS Tools (NUT) Integration Component.
Component found. Select this element and get to the Connect to the NUT server pop-up window. We only need to enter two parameters: Username and Password, which we specified in the Network UPS Tools Add-on configuration earlier.
Figure 65: Specify the access parameters of the integration component to the Network UPS Tools service.
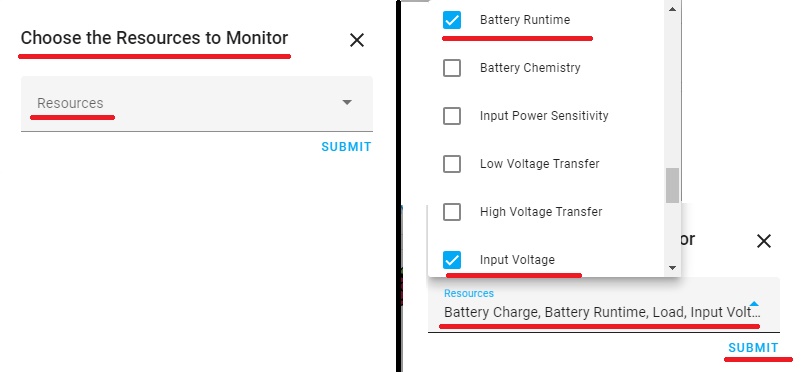
If we did not make a mistake in the user and password parameter and the previous steps of setup are performed correctly, we will be asked to select a list of resources (sensors) for monitoring. You can choose all, I chose only the following: Battery Charge, Battery Runtime, Input Voltage, Load, Self-Test Result, Status.
Figure 66: Selection of the list of resources (sensors) for monitoring.
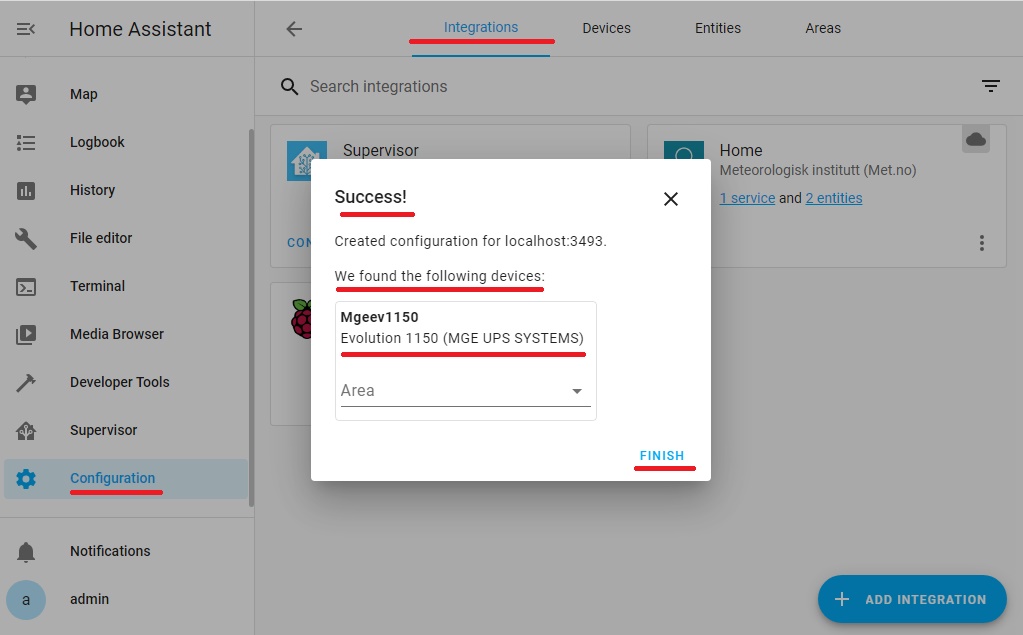
In the final dialog, you will be prompted to link this object to the area of your Smart Home. We will not make this binding at the moment.
Congratulations! All our actions were performed successfully.
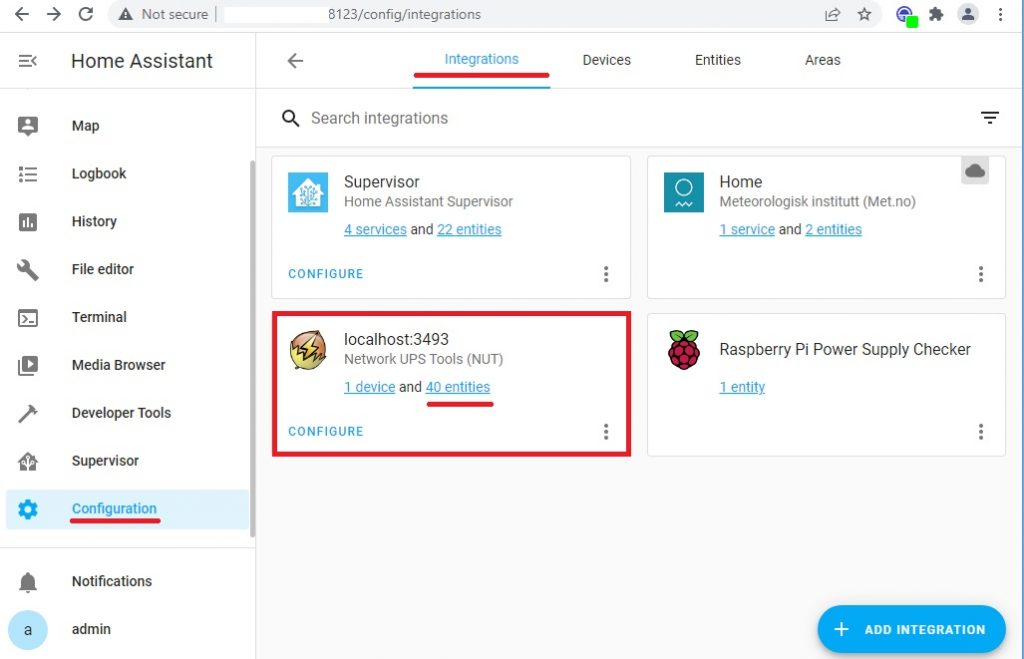
The list of integrations includes a new integration component Network UPS Tools (NUT), which receives data from the server.
Figure 68: New integration component Network UPS Tools (NUT) in the list of installed integrations.
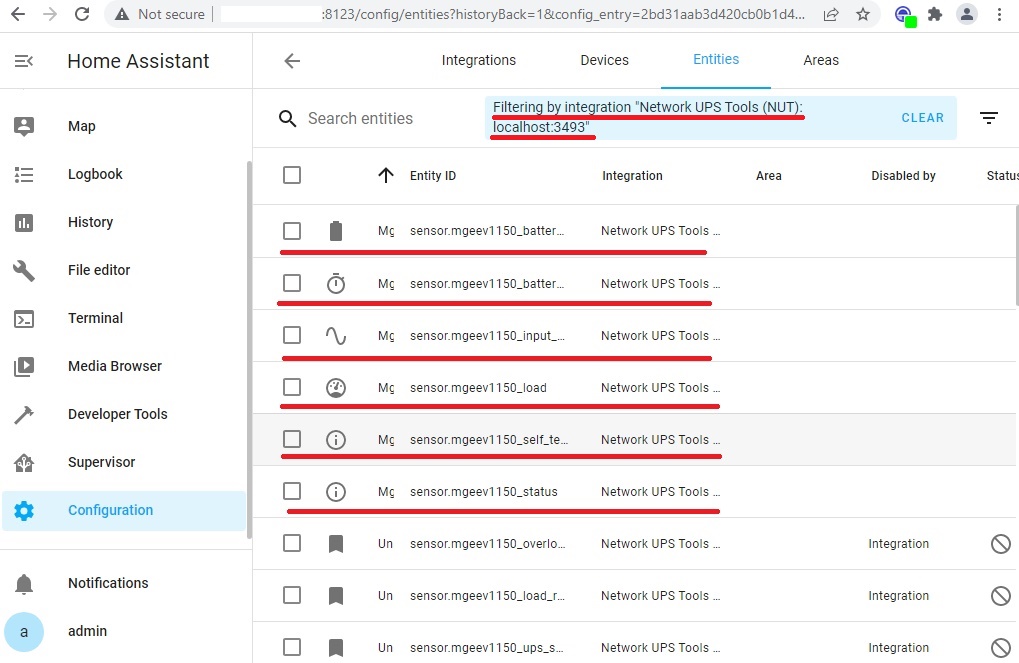
Select the 40 entities link to go to the list of filtered sensors. The sensors we have selected are active, all others are off.
Figure 69: Filtered List of active and disabled sensors Network UPS Tools (NUT).
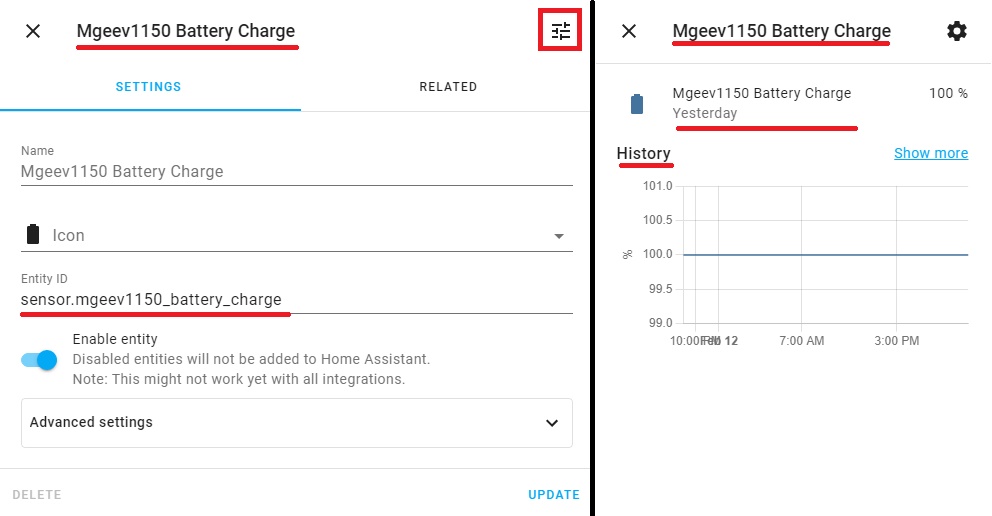
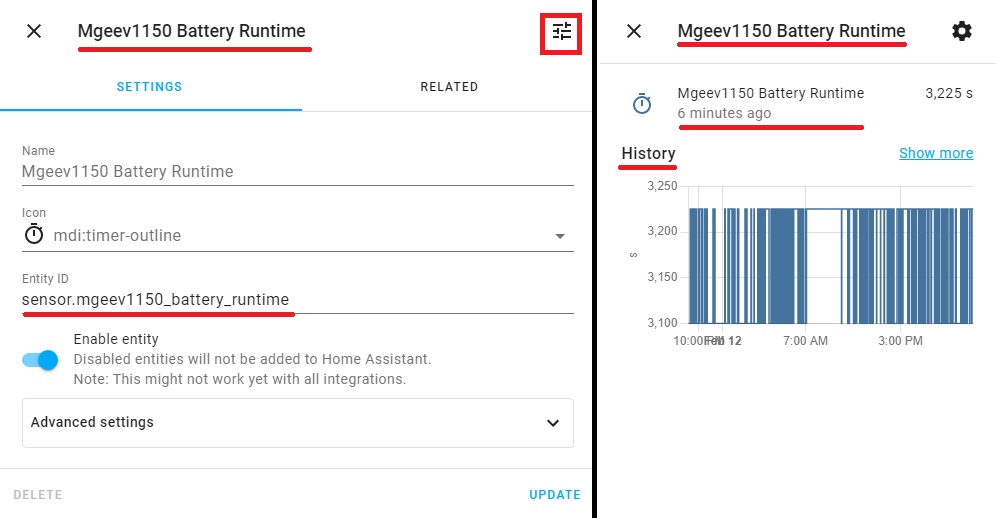
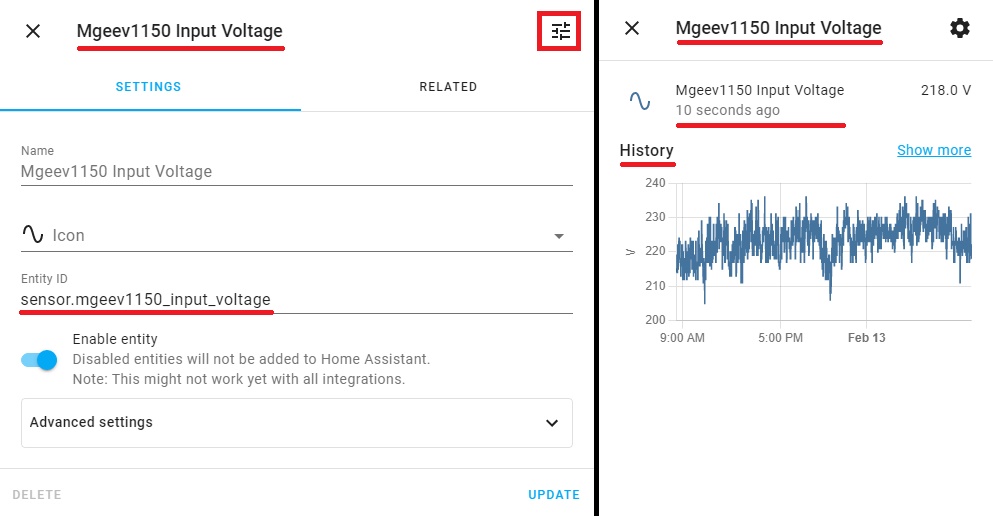
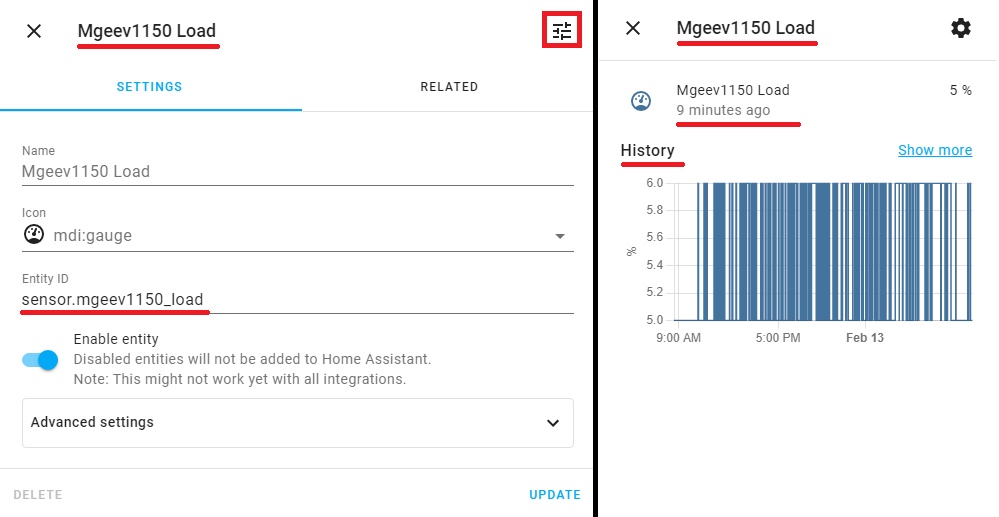
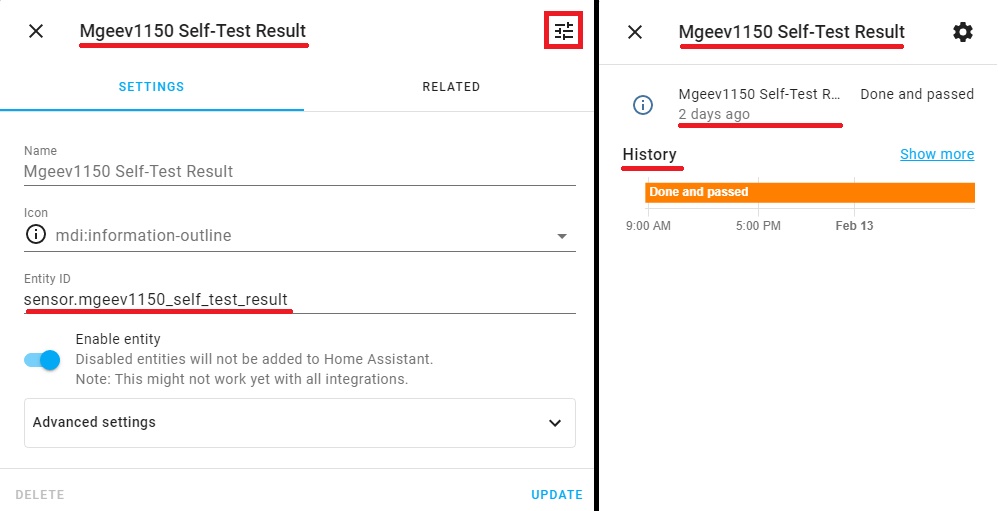
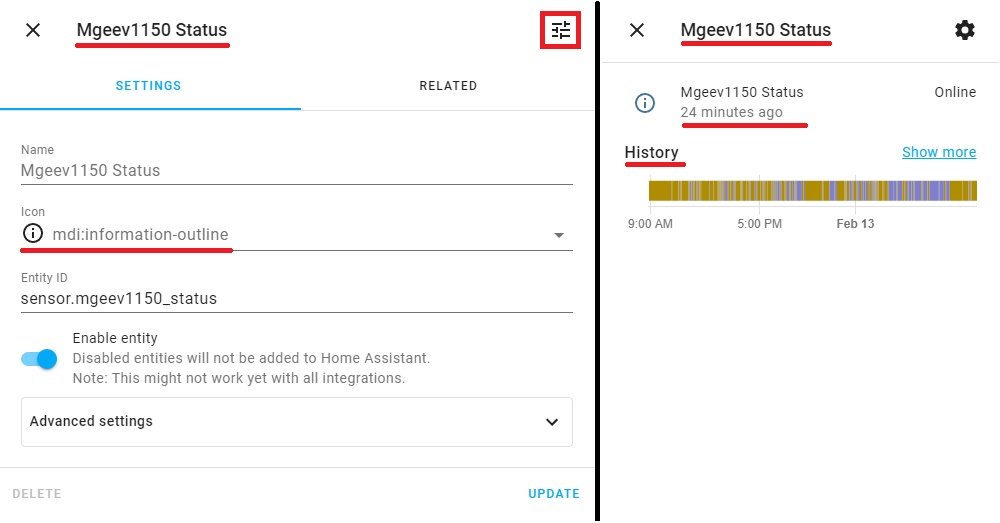
Similar to the steps described above in this article, we will open pop-ups with sensor parameters Mgeev1150Battery Charge, Battery Runtime, Input Voltage, Load, Self-Test Result, Status and data collected in historical terms.
Figure 70: Information about the state of the Mgeev1150 Battery Charge sensor and the collected data in historical terms.Figure 71: Information about the state of the Mgeev1150 Battery Runtime sensor and the collected data in historical terms. Figure 72: Information about the state of the Mgeev1150 Input Voltage sensor and the collected data in historical terms. Figure 73: Information about the state of the Mgeev1150 Load sensor and the collected data in historical terms. Figure 74: Information about the state of the Mgeev1150 Self-Test Resultsensor and the collected data in historical terms. Figure 75: Information about the state of the Mgeev1150 Self-Test Resultsensor and the collected data in historical terms. Figure 76: Information about the state of the Mgeev1150 Status sensor and the collected data in historical terms.
This will similarly complete the work with Network UPS Tools (NUT) monitoring sensors. In the following publications, we will explain how to configure the display of these sensors on the Lovelace panels of the Home Assistant.
What’s next?
So at the moment we know about the health of the hardware, software and database of our Smart Home core. We learned how to add and customize Add-on application components and Integrations. We also have information on the status of the power supply and the parameters of the uninterruptible power supply.
Do not forget to update the system and back up.
At this stage we will pause, and in the next publication we will tell about: