

Step by step…
Congratulations to all who have been looking forward to the next post in the series “My Smart Home. From the beginning, Step by step to… ”. At the moment we have a working copy of the Home Assistant. From the software applications we have the File Editor and Terminal. We made the first settings in the configuration.yaml configuration file and updated the system to the current version.
Today we will talk about Sensors for monitoring the parameters of the hardware system – Raspberry Pi Power Quality Control Sensor and Processor Temperature sensor. It is also important to know about the health of the software part of the Home Assistant system: we configure the Sensors to monitor the status of the Processor, Memory, Disk and Network. Home Assistant stores the collected data in a database, so we will monitor the growth of its volume with an appropriate sensor. With the help of integration, we will control the Internet connection. We will also configure communication with external devices: configure the control sensors of the Uinterruptible Power Supply.
So, get comfortable, it will be interesting!
Sensors for monitoring system parameters.
All the functioning of our Smart Home depends on the reliable work of the Home Assistant. We entrust control of the basic parameters to the corresponding sensors. Of the hardware, it is the Raspberry Pi power quality control sensor and the processor temperature sensor. From software, – control of loading of the processor, memory, a disk, a network. It is also important to control Internet access settings.
Let’s start with hardware sensors.
● ● ●
Raspberry Pi Power Quality Control Sensor.
On all models of Raspberry Pi since the Raspberry Pi B+ (2014) except the Zero range, there is low-voltage detection circuitry that will detect if the supply voltage drops below 4.63V (+/- 5%). This will result in a warning icon being displayed on all attached displays and an entry being added to the kernel log.
Raspberry Pi Power Supply Checker is based on this algorithm. In the Home Assistant, it is activated by adding the integration component of the same name.
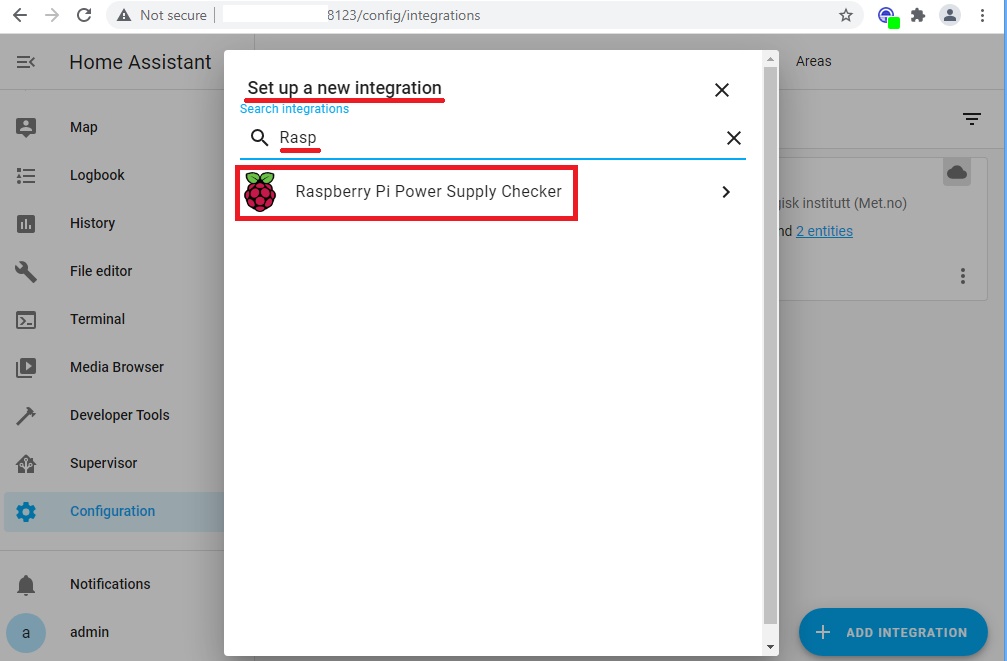
To add this component to the integration, use the Configuration menu, Integration tab. Choose + Add Integration:

Raspberry Pi Power Supply Checker.
In the new window Set up a new integration in the search field enter Rasp. The search result should be displayed as a found integration component Raspberry Pi Power Supply Checker:
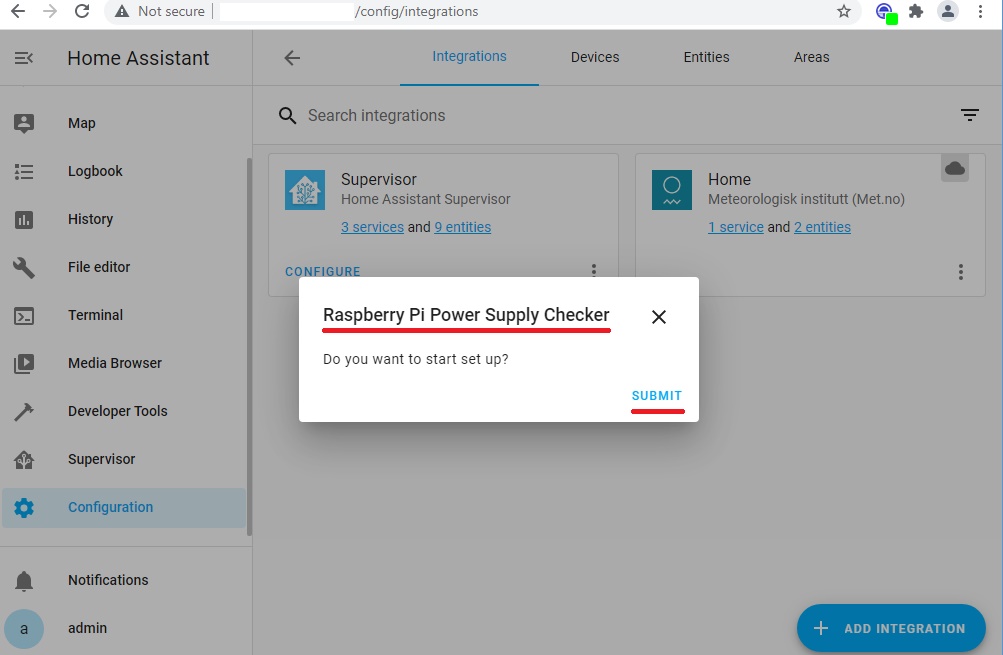
We confirm the installation of the Raspberry Pi Power Supply Checker integration component:
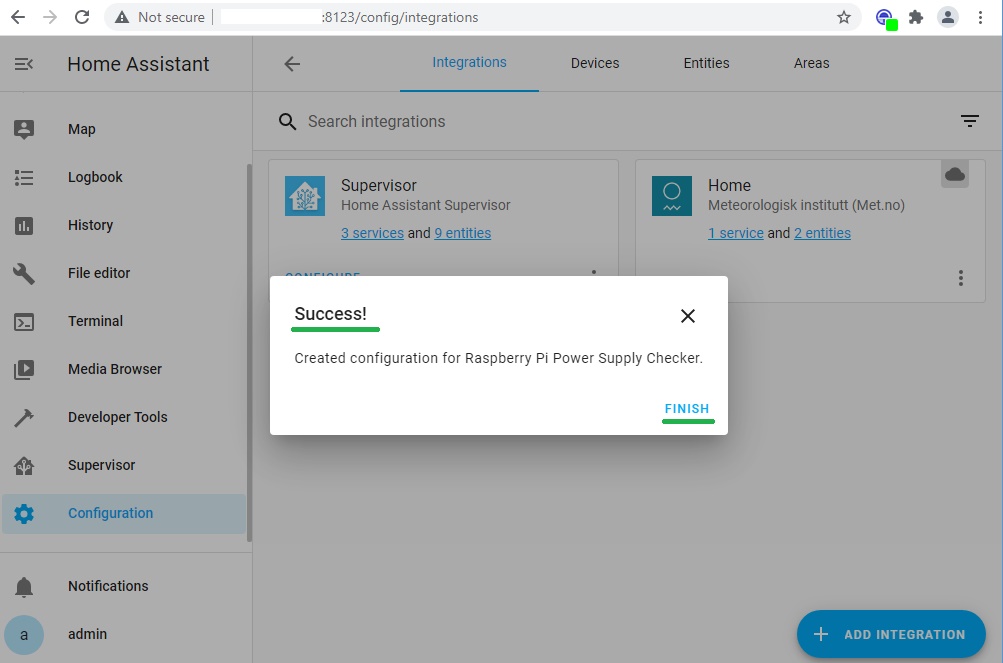
If the Raspberry Pi Power Supply Checker is successfully installed, we receive the following message:
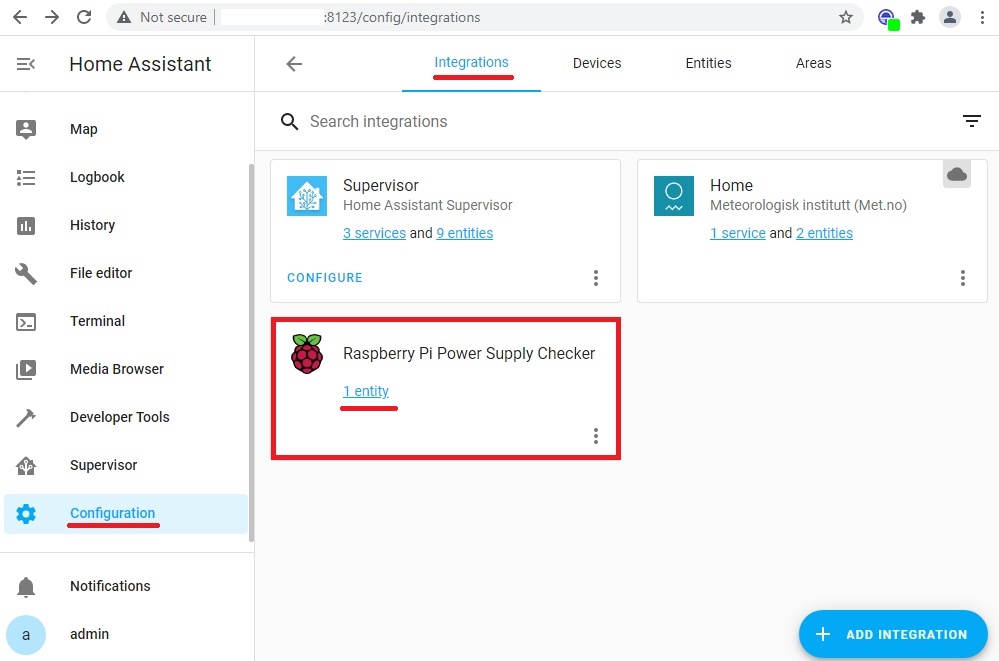
And the newly installed component will appear in the list of integrations:
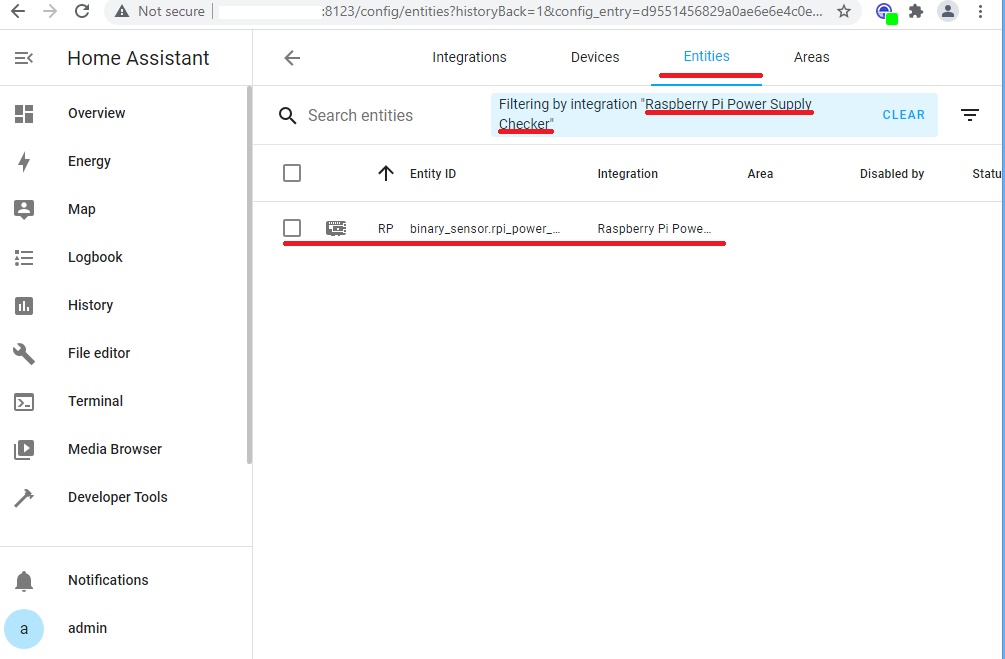
Select the link – 1 entity, and on the Entity tab we will get the filter of integration elements “Raspberry Pi Power Supply Checker”:
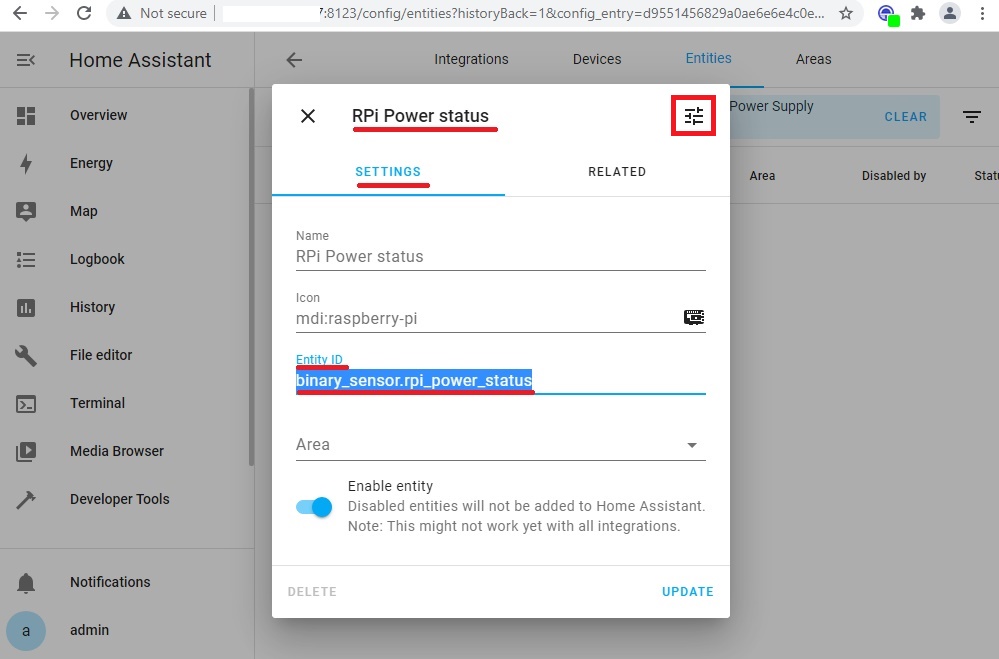
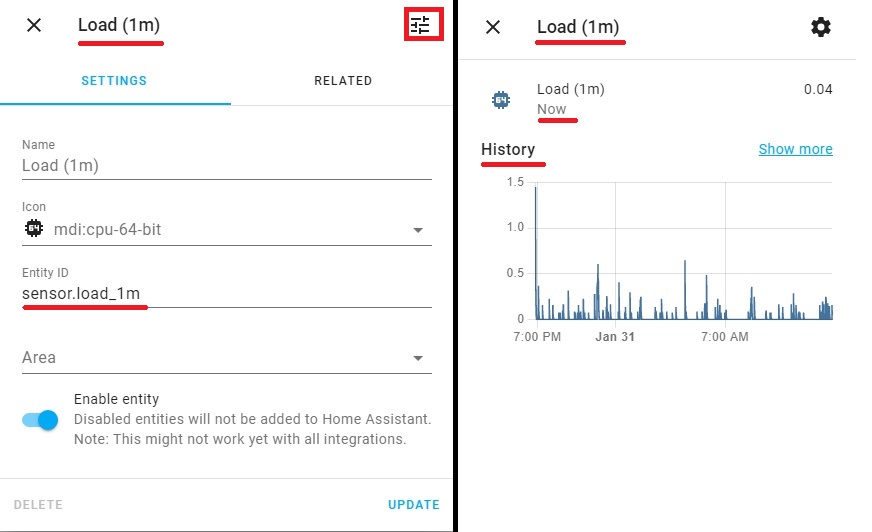
Let’s select this filtered element and find out some of its parameters in the RPi Power Status pop-up window. We are primarily interested in Entity ID: binary_sensor.rpi_power_status. Let’s write down this meaning for ourselves, we will need it later.
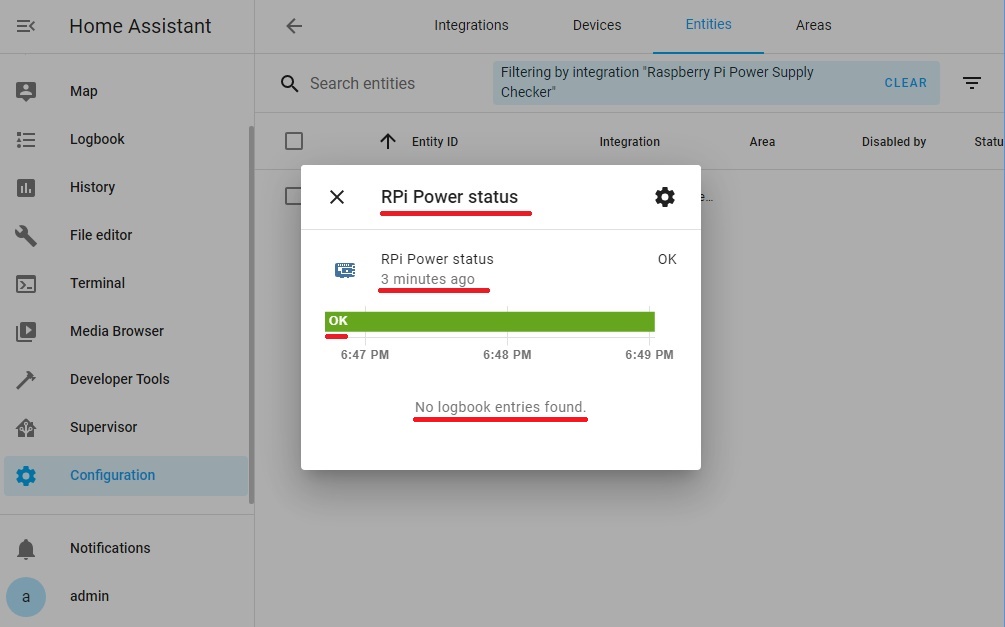
We will also open another RPi Power Status pop-up window using the icon at the top right. But we will see the status of the sensor, and the message that the history of the change has already begun to work, and events in the logbook are not yet found. This is normal because the state of the sensor has not changed since installation.
This concludes the work with this element of integration. A little later, we will adjust the display of this sensor on the Lovelace panels of the Home Assistant.
● ● ●
Raspberry PI 4 Processor Temperature sensor.
Our copy of the Raspberry Pi will be housed in a case mounted on a din rail of the electrical switchboard. Therefore, the issue of cooling is very important. Before choosing a cooling strategy, let’s evaluate the actual values of the temperature sensor of the Raspberry PI 4 Processor. Especially since Home Assistant himself has every opportunity to do so.
So, let’s create a temperature sensor for the Raspberry PI 4 processor. To do this, add the following code section to the configuration.yaml file:
sensor:
 - platform: command_line
   name: RPi CPU Temperature
   command: "cat /sys/class/thermal/thermal_zone*/temp"
   unit_of_measurement: "°C"
   value_template: '{{ value | multiply(0.001) | round(1) }}'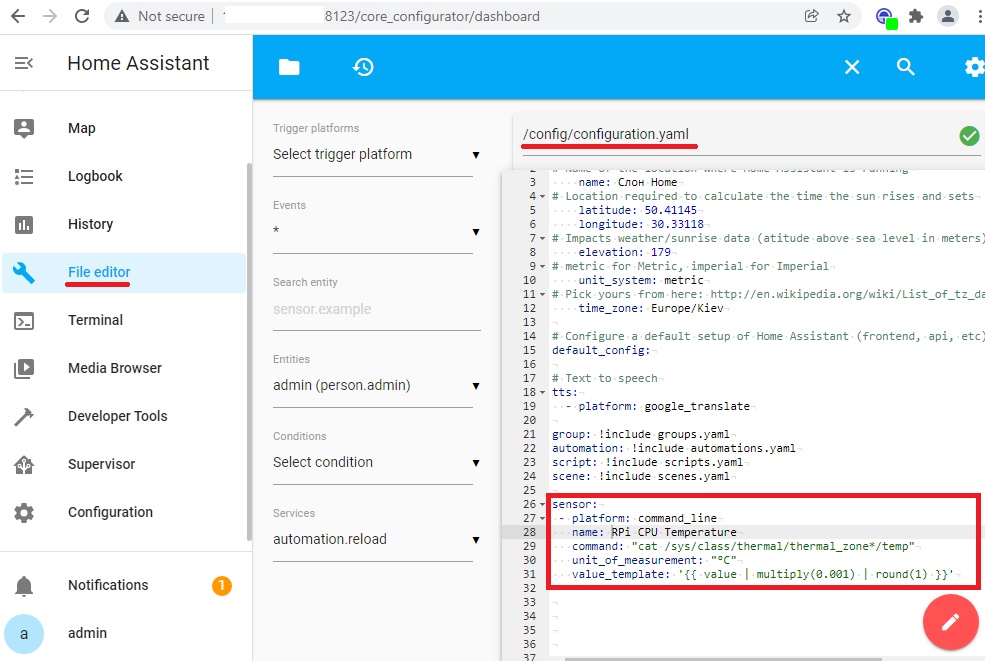
Let’s check the configuration:
ha core check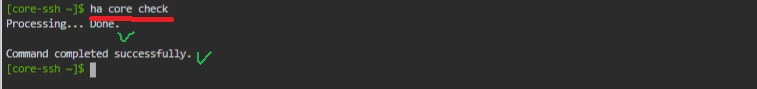
And reboot the system.
ha core restart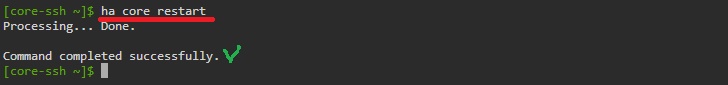
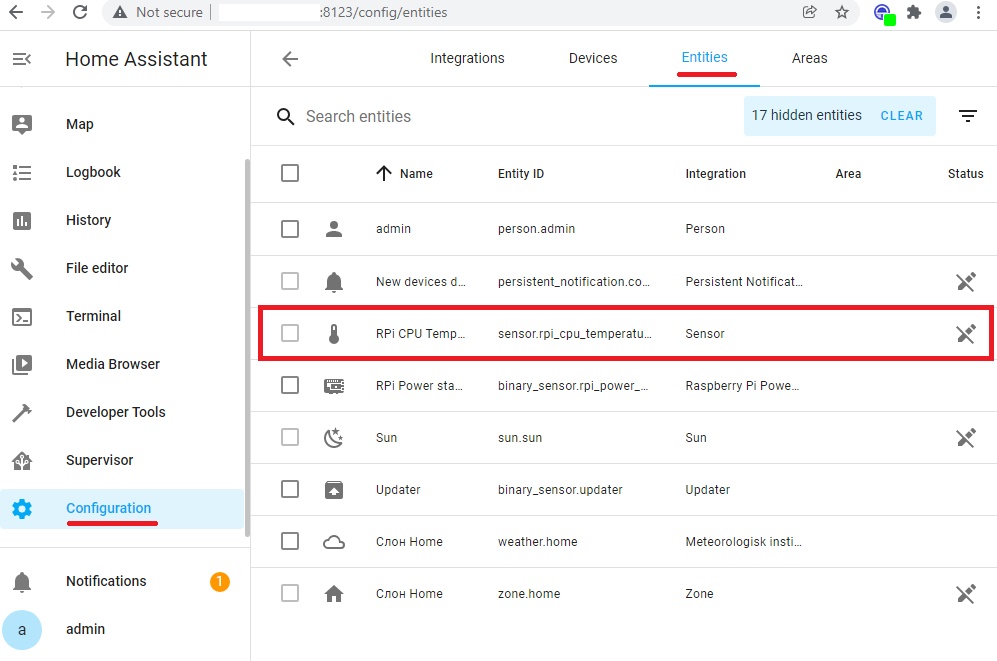
Check the presence of the added sensor in the Configuration menu on the Entities tab.
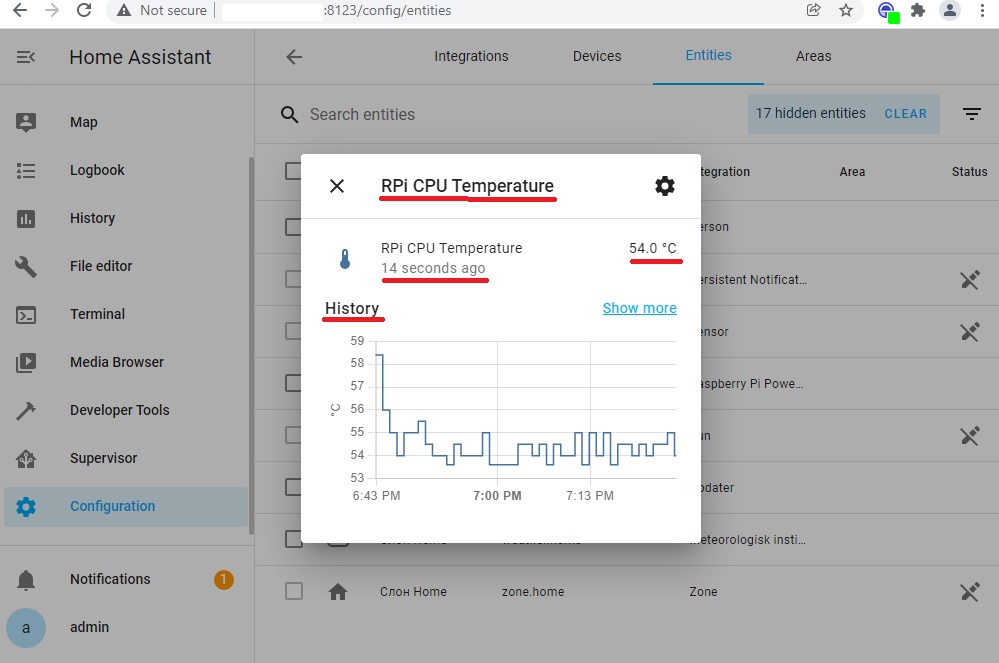
Select this item and immediately open another RPi CPU Temperature pop-up using the icon at the top right. There we will see the temperature values that the sensor recently measured as well as the historical data.
This concludes the work with this sensor. A little later, we will adjust the display of this sensor on the Lovelace panels of the Home Assistant.
● ● ●
Processor Monitoring Sensors.
Now let’s move from the hardware level of monitoring to software. We will be interested in the health parameters of such components of the Home Assistant OS as: Processor, Memory, Disks and Network.
Home Assistant has a built-in special platform called System Monitor with a set of sensors to monitor the local system. System Monitor allows you to monitor CPU usage and temperature, RAM and disk usage, traffic on network interfaces.
We will not immediately add all possible resource sensors to the monitoring. Let’s do it gradually, and start with CPU load sensors and system load sensors for the last 1 minute, 5 minutes, 15 minutes.
To activate the System Monitor platform and start collecting monitoring data in the configuration.yaml configuration file, add the following code:
sensor:
 - platform: systemmonitor
   resources:
     - type: processor_use
     - type: load_1m
     - type: load_5m
     - type: load_15m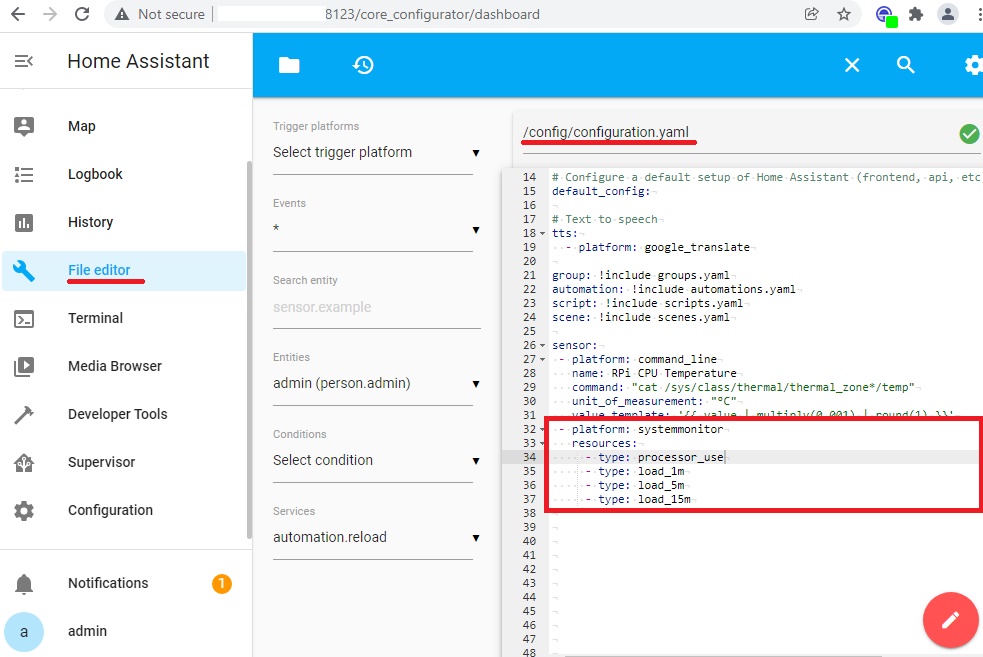
After adding the parameters, check the configuration and reboot the system, as described above.
Important: In the Home Assistant version of 2021.12, the design of the Configuration section has been changed:
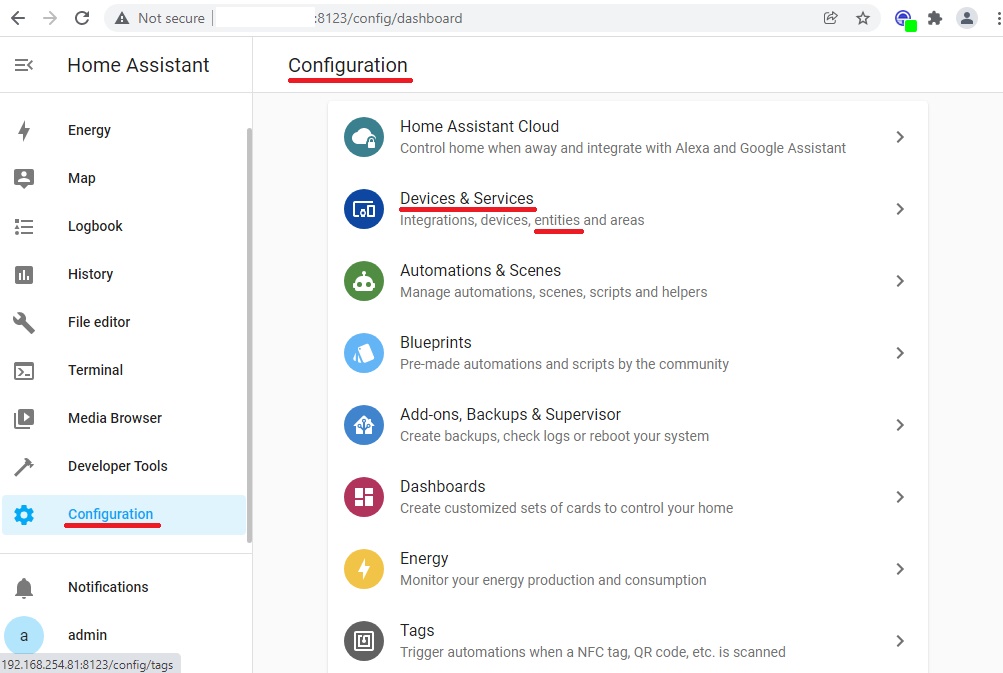
Therefore, to check the operation of the added sensors, go to the already known section of the Configuration menu, Now the section is called Devices and Services, and the name of the Entities tab remains unchanged.
Here we will see recently added sensors:
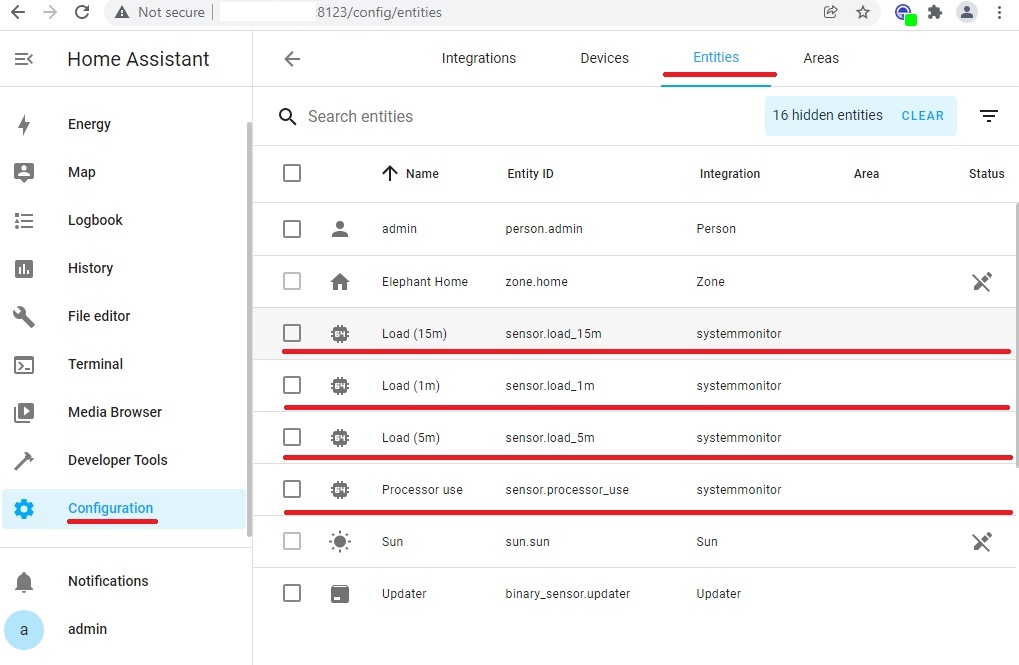
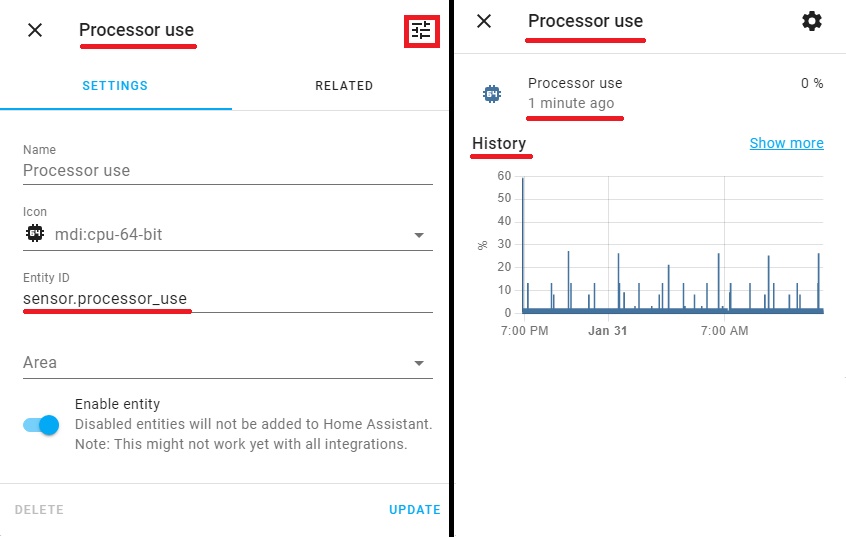
Similar to the above steps, open the Processor Use pop-ups with information about the status of the sensor and the collected data in historical terms.
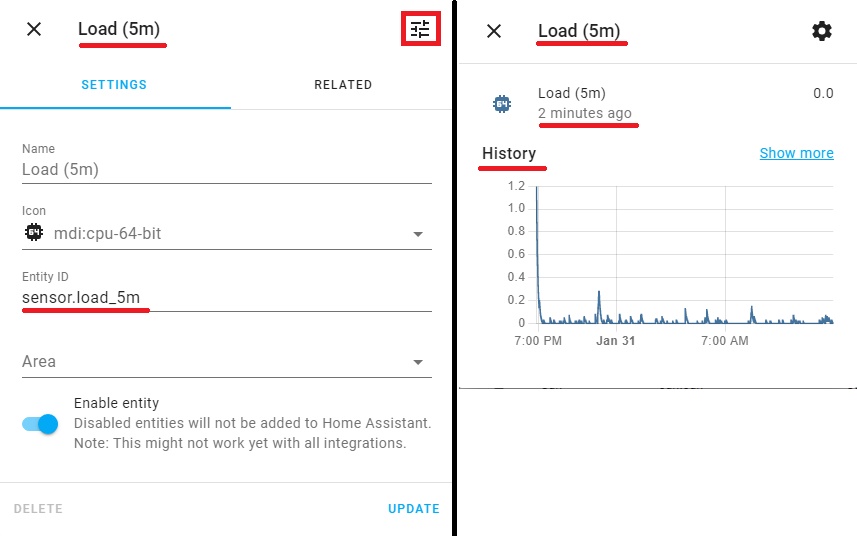
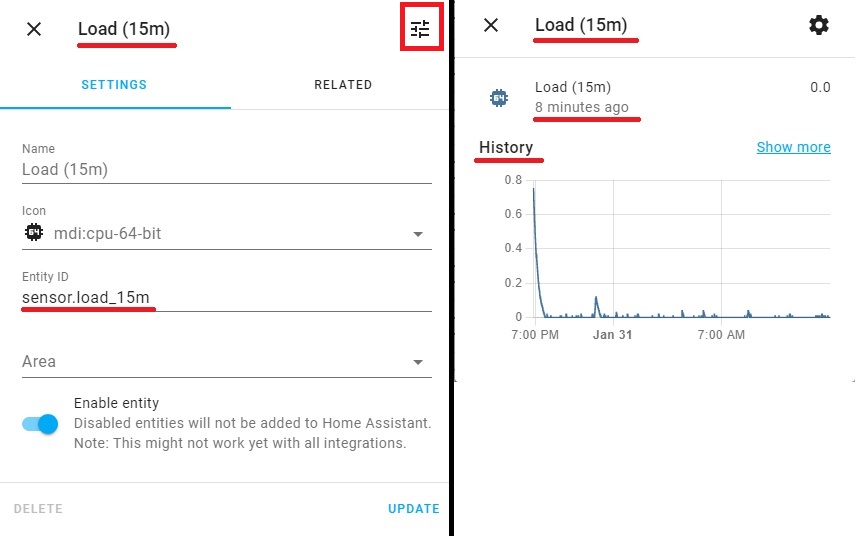
Perform similar steps for Load (1m), Load (5m), Load (15m) sensors.
This concludes the work with these sensors. A little later, we will adjust the display of these sensors on the Lovelace panels of the Home Assistant.
● ● ●
Memory Monitoring Sensors.
Now let’s move on to configuring and testing the memory usage monitoring sensors. Add a few more lines to the code we added above:
     - type: memory_use_percent
     - type: memory_use
     - type: memory_free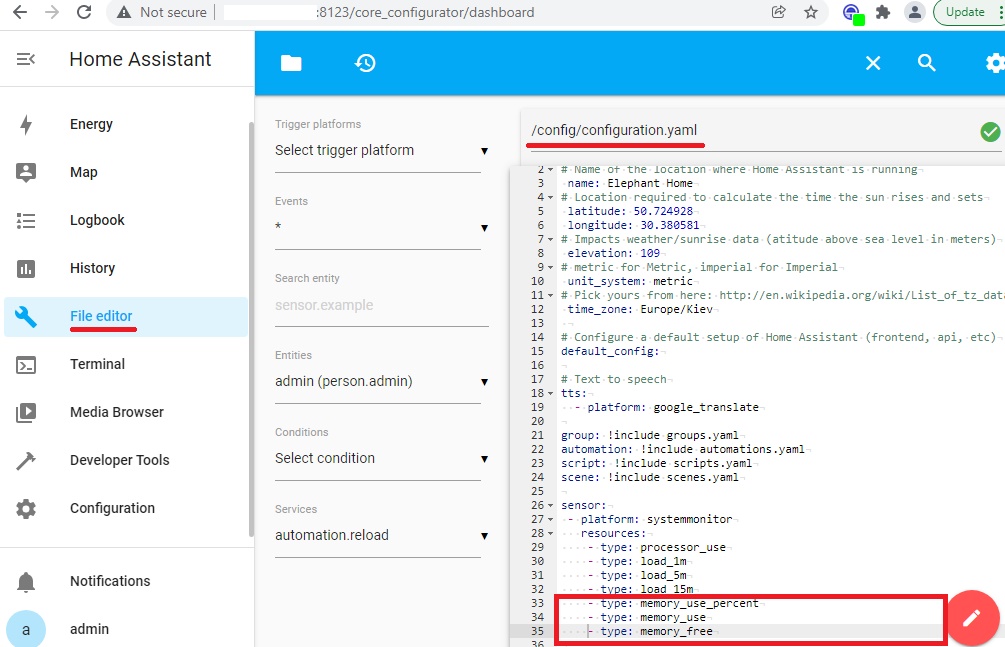
After adding the parameters, you should check the configuration again and reboot the system, as described above.
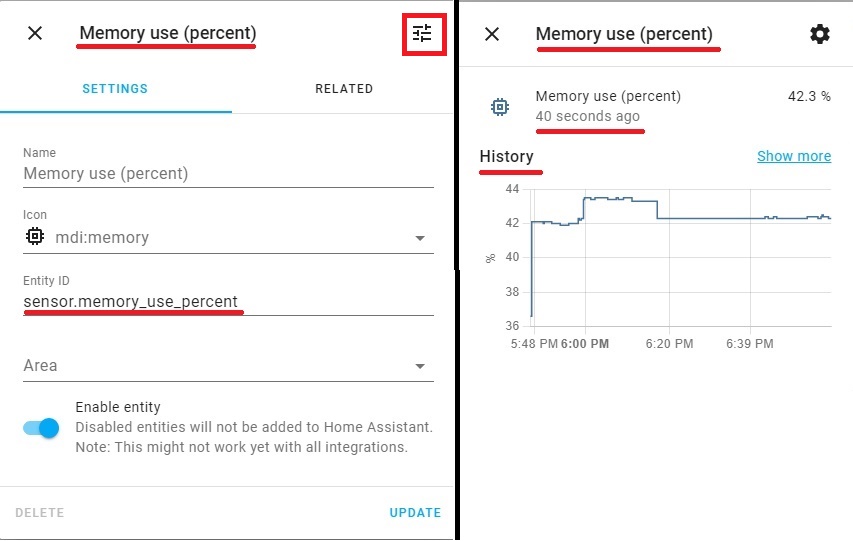
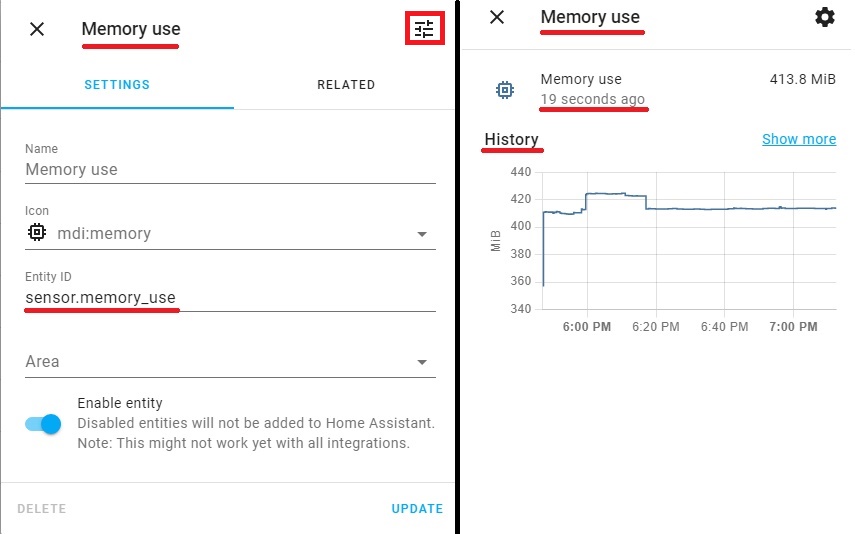
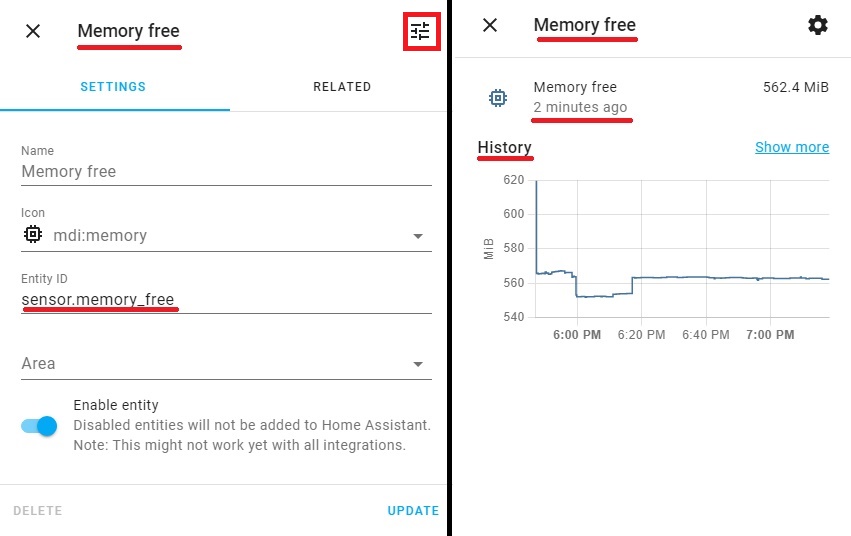
To check the operation of the added sensors, go to the already known section of the Configuration menu, Devices and Services section, Entities tab. Here we will see recently added sensors:
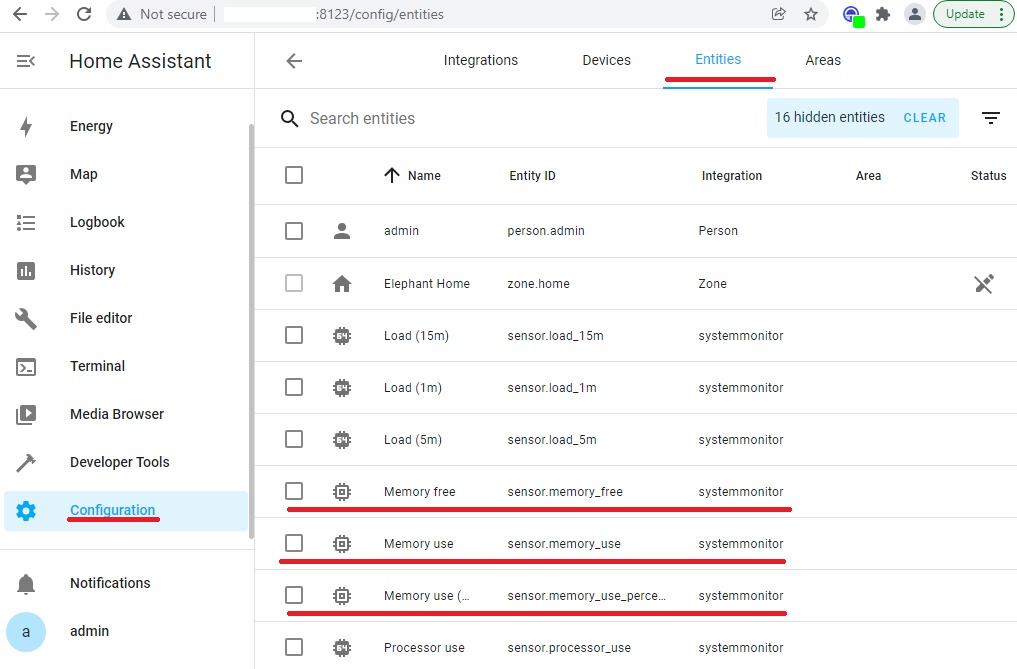
Similar to the above steps, open the “Memory use (persent)”, “Memory use”, “Memory free” pop-ups with information about the status of the sensor and the collected historical data.
This will similarly complete the work with these sensors. A little later, we will adjust the display of these sensors on the Lovelace panels of the Home Assistant.
● ● ●
Disk Monitoring Sensors.
The next step is to configure and test the disk usage and swap file sensors. Add a few more lines to the code we added above:
     - type: disk_use_percent
     - type: disk_use
     - type: disk_free
     - type: swap_use_percent
     - type: swap_use
     - type: swap_free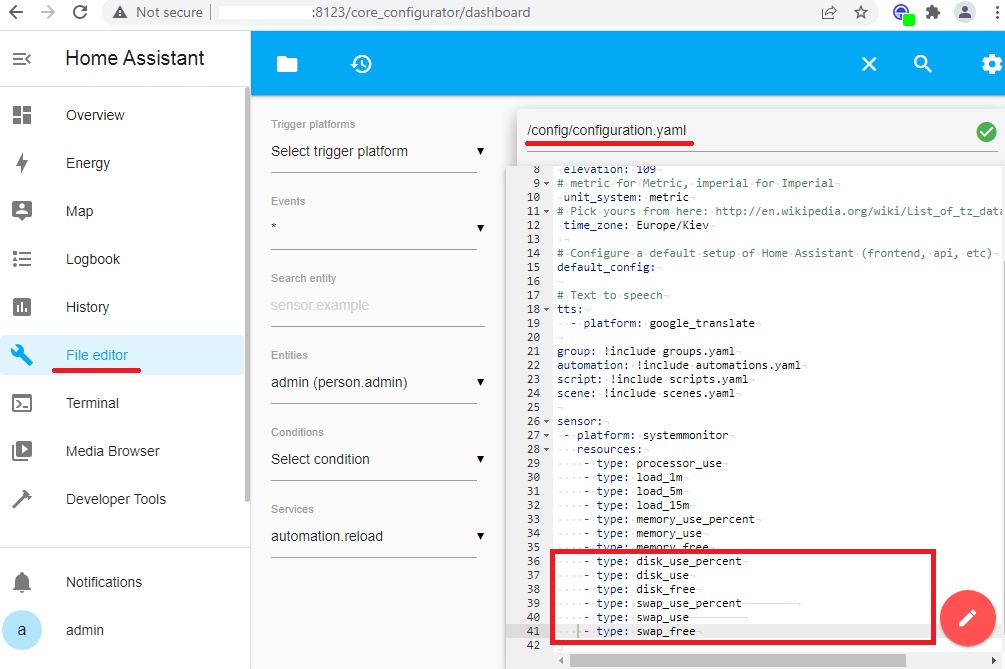
After adding the parameters, you should check the configuration again and reboot the system, as described above.
The test is similar to the steps described above: In the Configuration menu, Devices and Services section, on the Entities tab, we will see the recently added sensors:
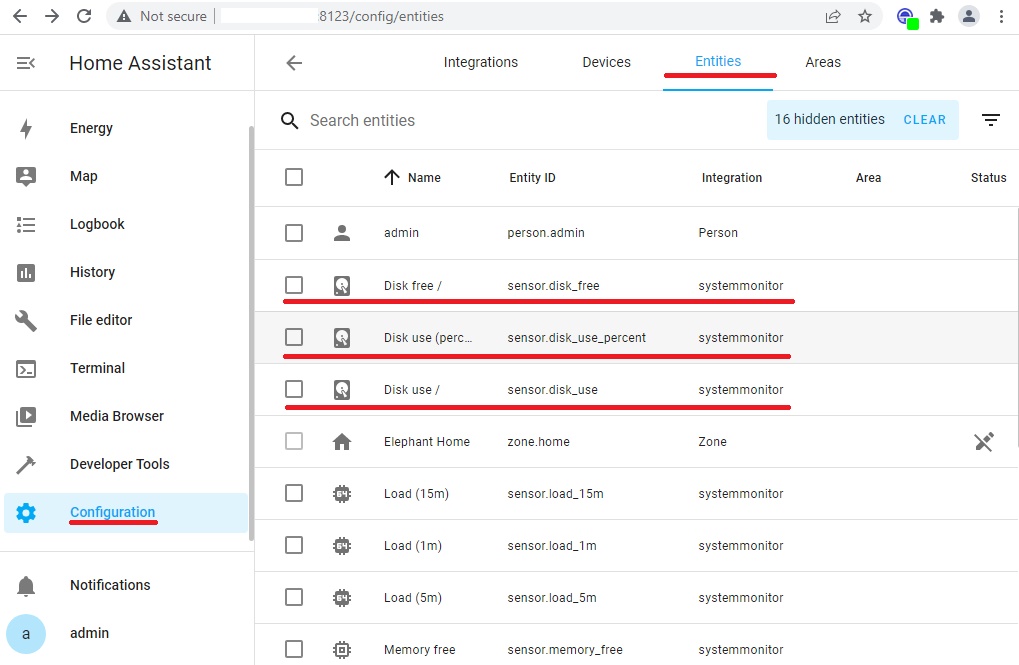
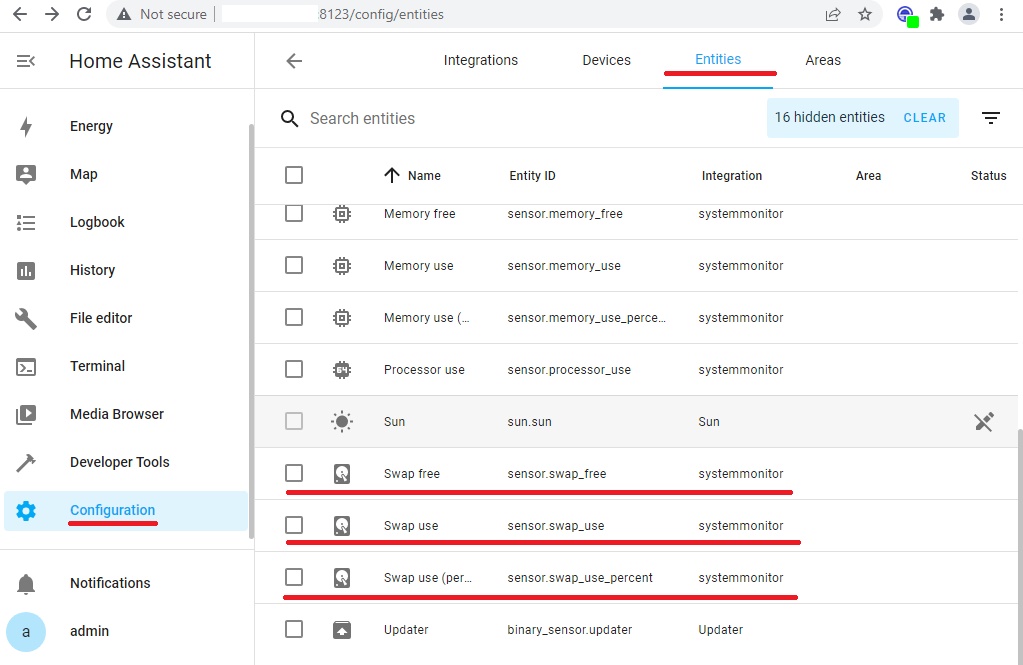
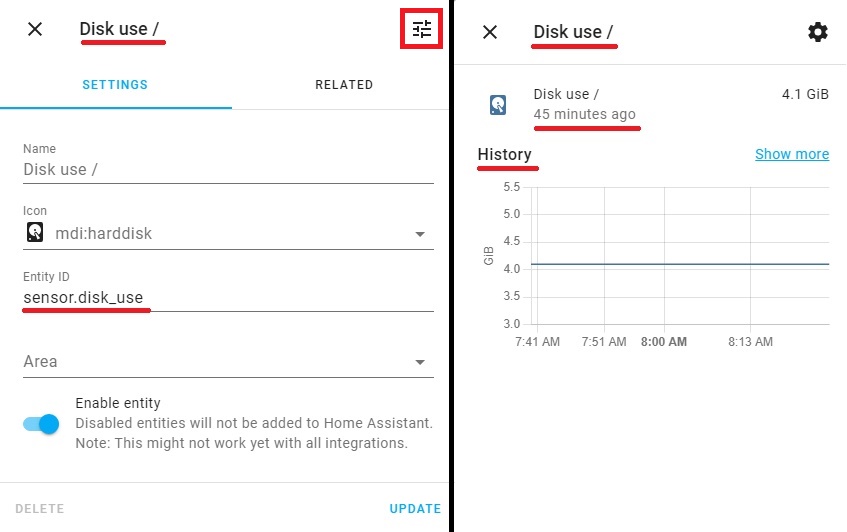
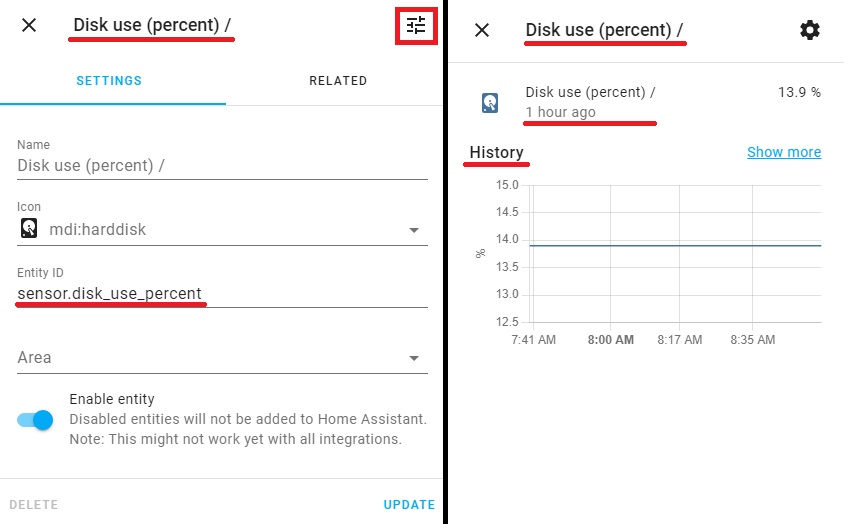
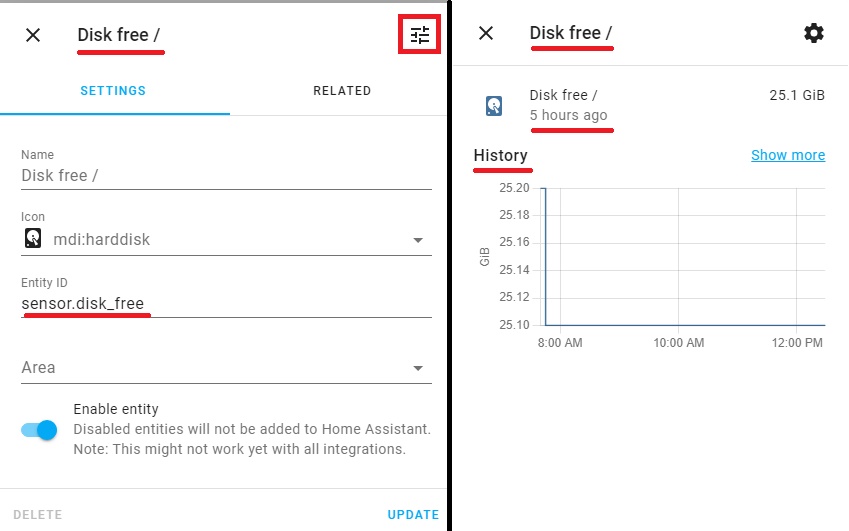
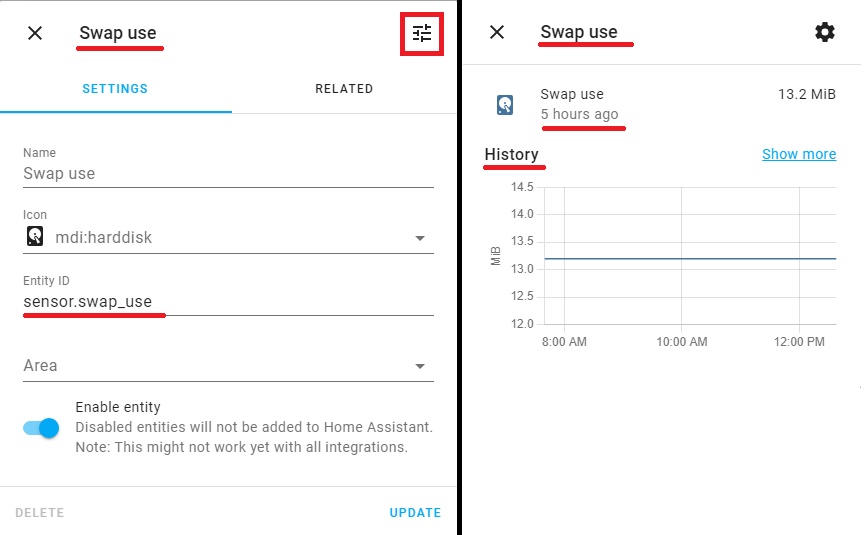
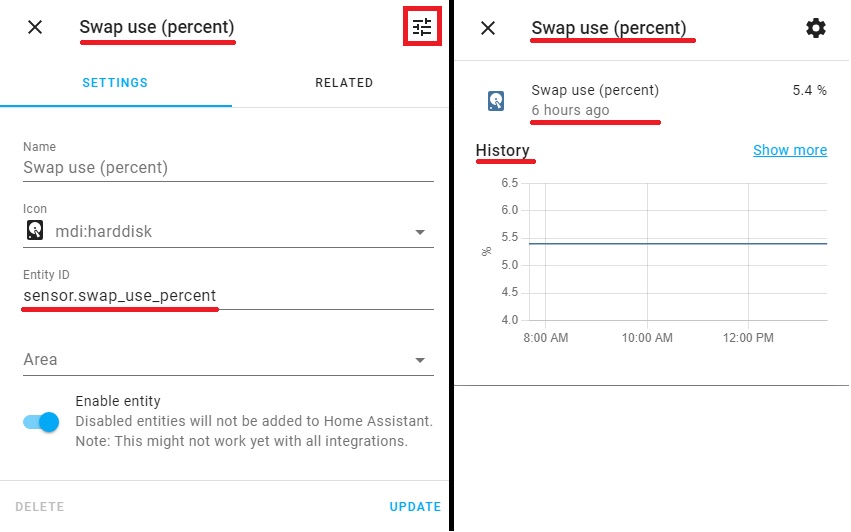
Similar to the above steps, open the “Disk use / “, “Disk use / (percent)“, “Disk free /”, “Swap use“, “Swap use (percent)“, “Swap free” pop-ups with information about the status of the sensor and the collected data in historical terms.
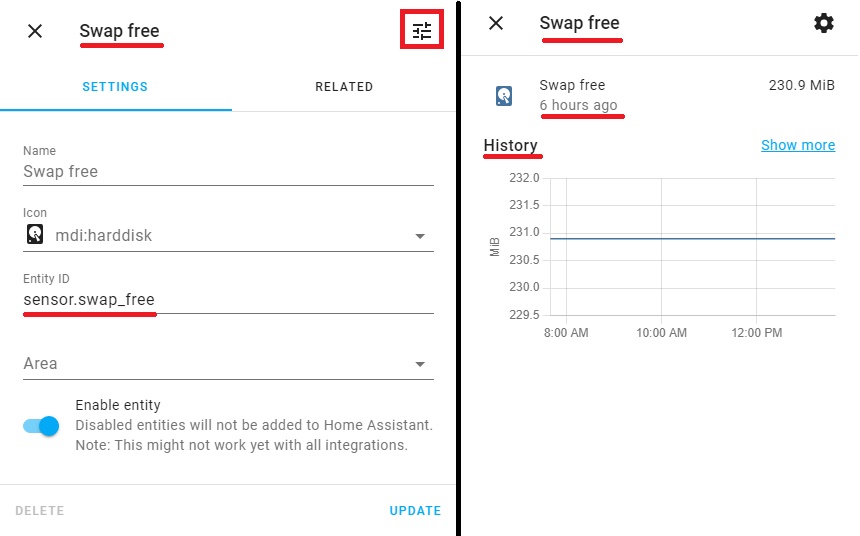
This will similarly complete the work with these sensors. A little later, we will adjust the display of these sensors on the Lovelace panels of the Home Assistant.
● ● ●
Network Monitoring Sensors.
Finally, the last group of sensors in the System Monitor platform is network monitoring sensors. But before adding the code to the configuration file, you need to find out the required parameter – the alias of the network interface.
This can be done with the following command:
ha network info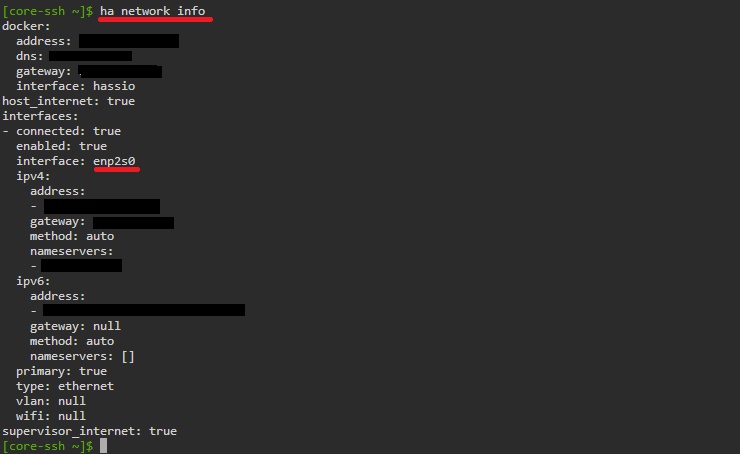
And now, to the code we added above, we add a few more lines, using the alias just clarified as an argument:
- type: network_in
arg: enp2s0
- type: network_out
arg: enp2s0
- type: throughput_network_in
arg: enp2s0
- type: throughput_network_out
arg: enp2s0
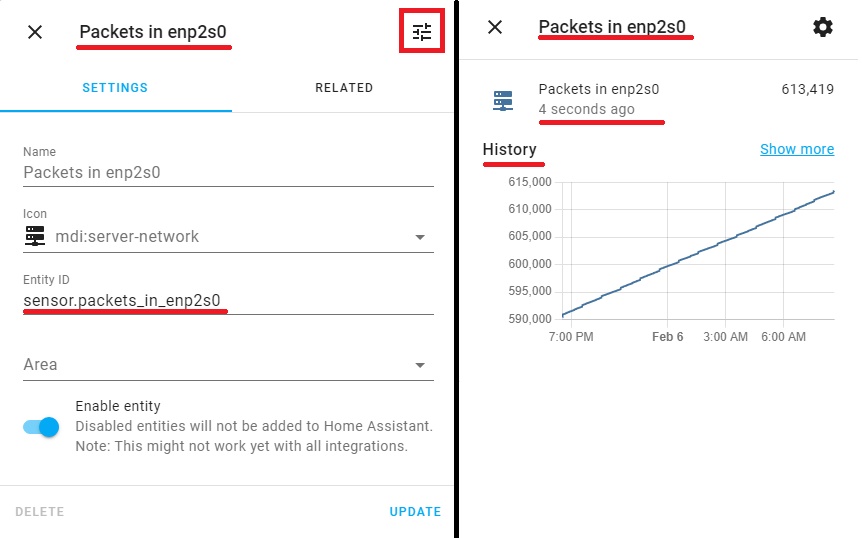
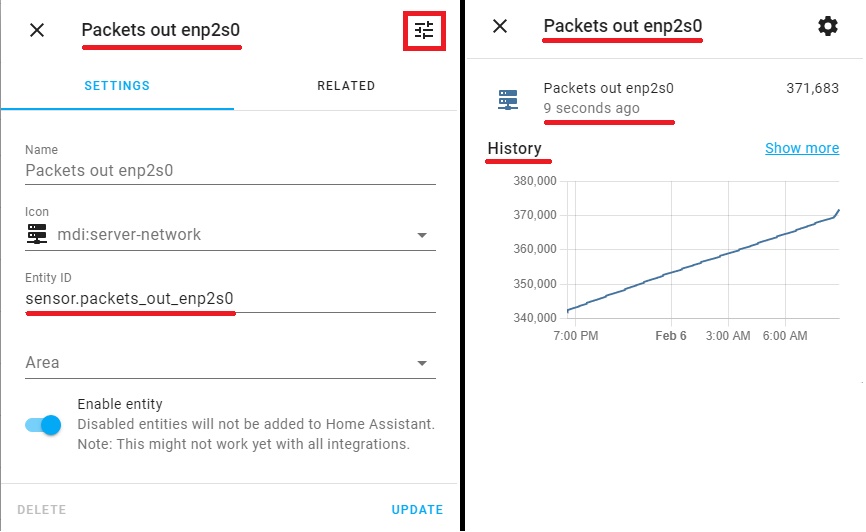
- type: packets_in
arg: enp2s0
- type: packets_out
arg: enp2s0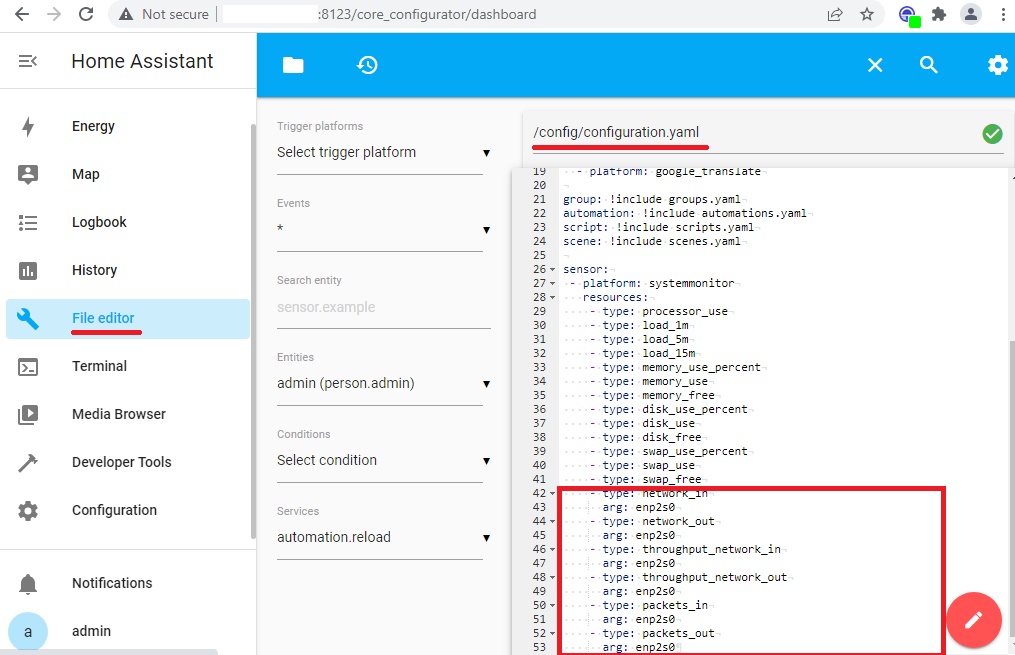
After adding the parameters, you should check the configuration again and reboot the system, as described above.
The test is similar to the steps described above: In the Configuration menu, Devices and Services section, on the Entities tab, we will see the recently added sensors:
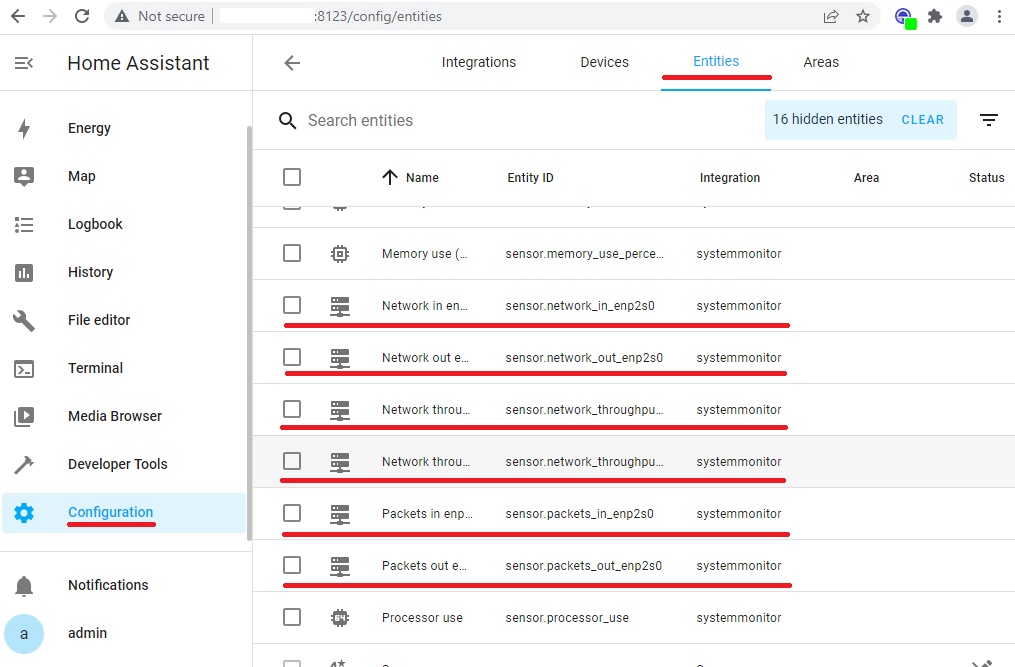
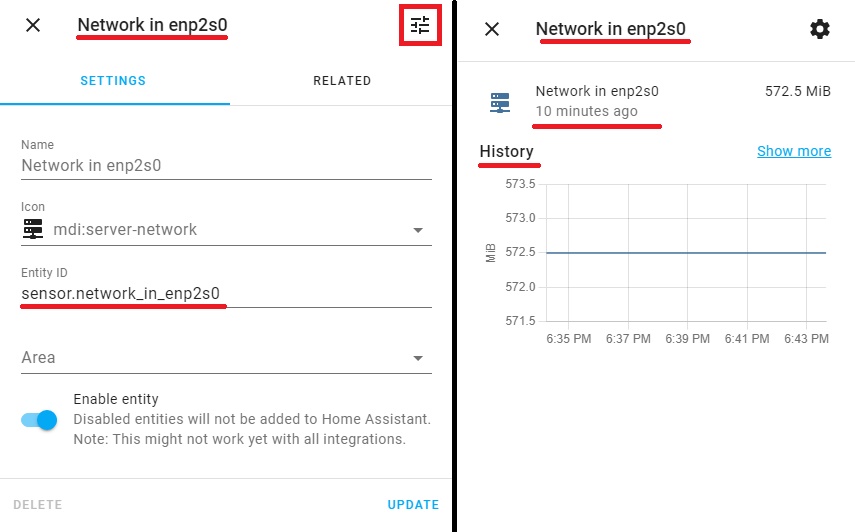
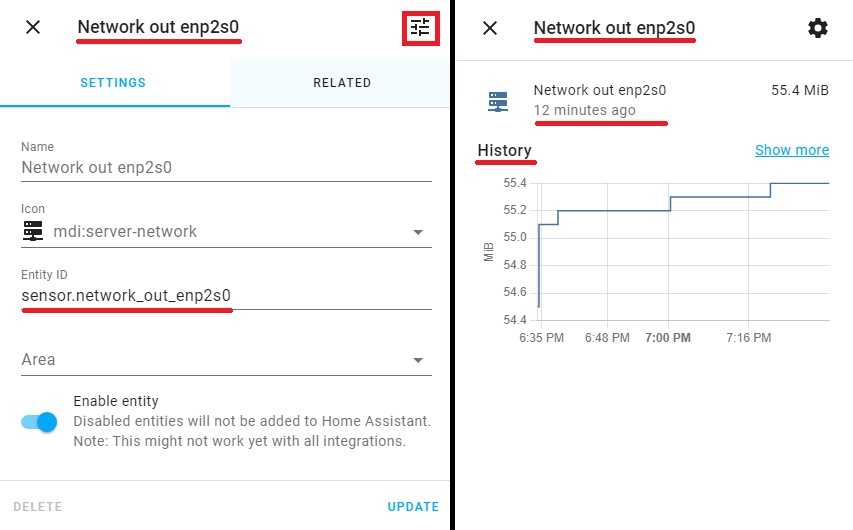
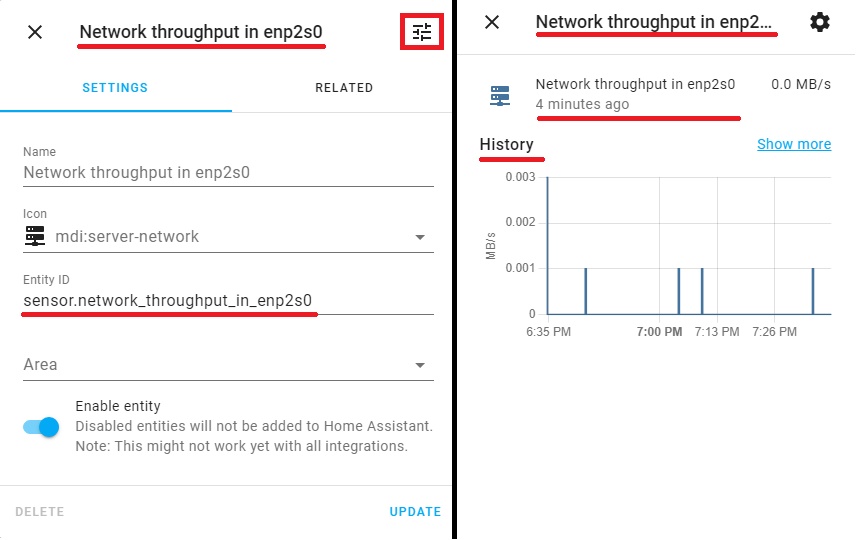
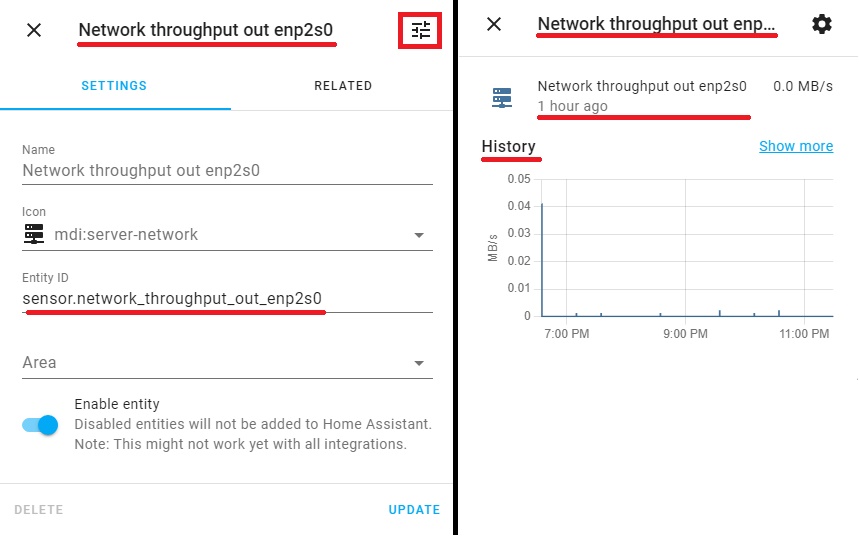
Similar to the above steps, open the “Network in enp2s0”, “Network out enp2s0”, “Network throughput in enp2s0”, “Network throughput out enp2s0“, “Packets in enp2s0“, “Packets out enp2s0” pop-ups with information about the status of the sensor and the collected data in historical terms.
This will similarly complete the work with System Monitor sensors. We have considered the full range of sensors on this platform. A little later we will adjust the display of all sensors on the lovelace panels of the Home Assistant. And now let’s move on to monitoring another important component of Home Assistant.
Home Assistant Database Size monitoring.
Monitoring the size of the Home Assistant database is very important. The database will expand during long-term use and after adding a significant amount of integration. The larger the database, the more SQLite read and write operations, which means that Home Assistant slows down. Extreme I / O will increase the load on the SD card, which means their accelerated degradation and failure.
In the default configuration, Home Assistant keeps a history of all events and states for all objects for approximately 10 days. This data provides the functions of History and Logbook. The data itself is stored using the Recorder integration, which by default writes it to the SQLite database file located in /config/home-assistant_v2.db.
The topic of database tuning is beyond the scope of this publication, but I promise that we will return to this issue later. For now, we will focus only on the process of monitoring the size of the database.
We add such code to the configuration.yaml file:
homeassistant:
  allowlist_external_dirs:
    - "/config"
sensor:
  - platform: filesize
    file_paths:
      - /config/home-assistant_v2.db
    scan_interval: 1800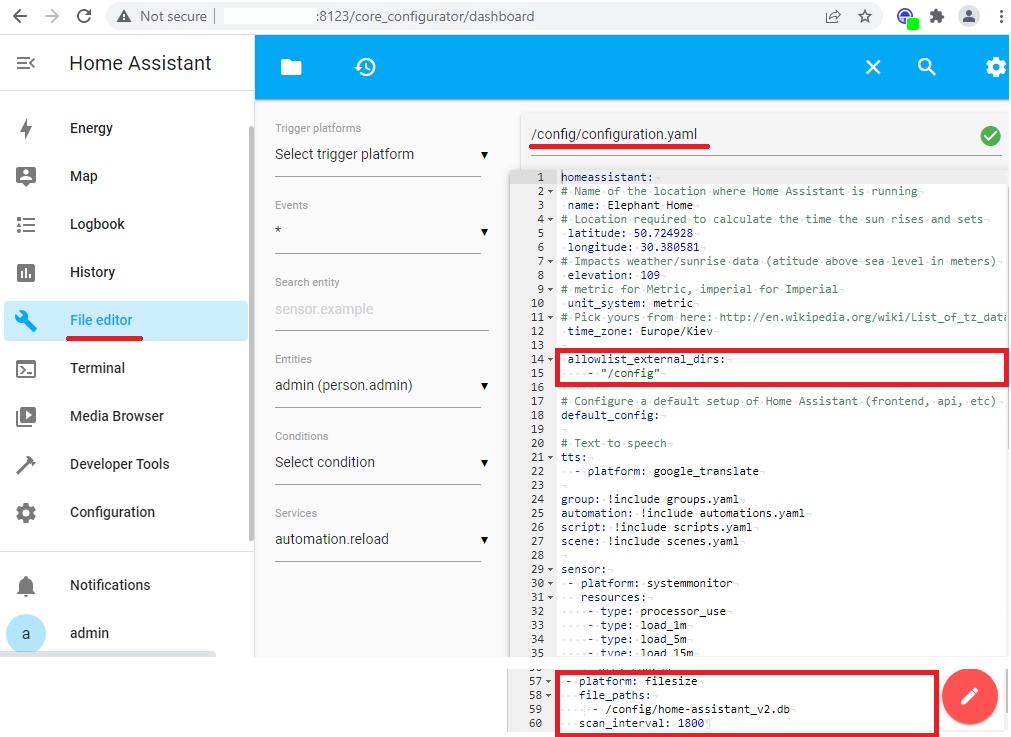
This sensor will be updated every half minute. Because each state change will add a couple of lines to the recorder’s database, we reduce the refresh rate with the scan_interval parameter.
After adding the parameters, you should check the configuration again. But to use them, this time you need to restart the host. This can be done with the following command:
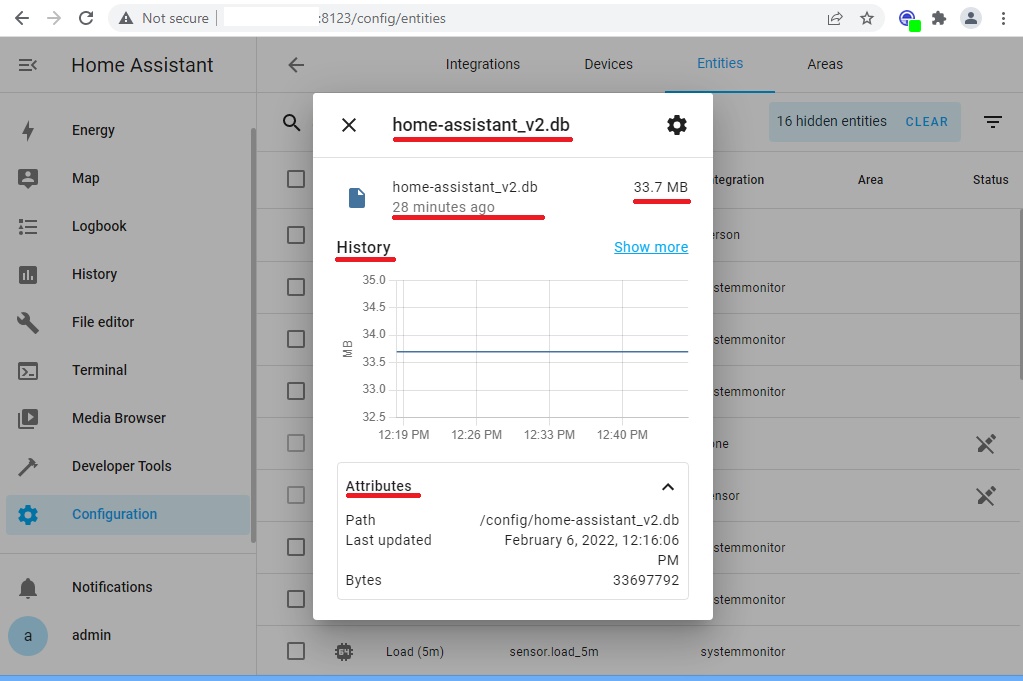
ha host rebootAfter rebooting, perform the verification in the same way as above: In the Configuration menu, Devices and Services section, on the Entities tab, we will see the recently added sensor:
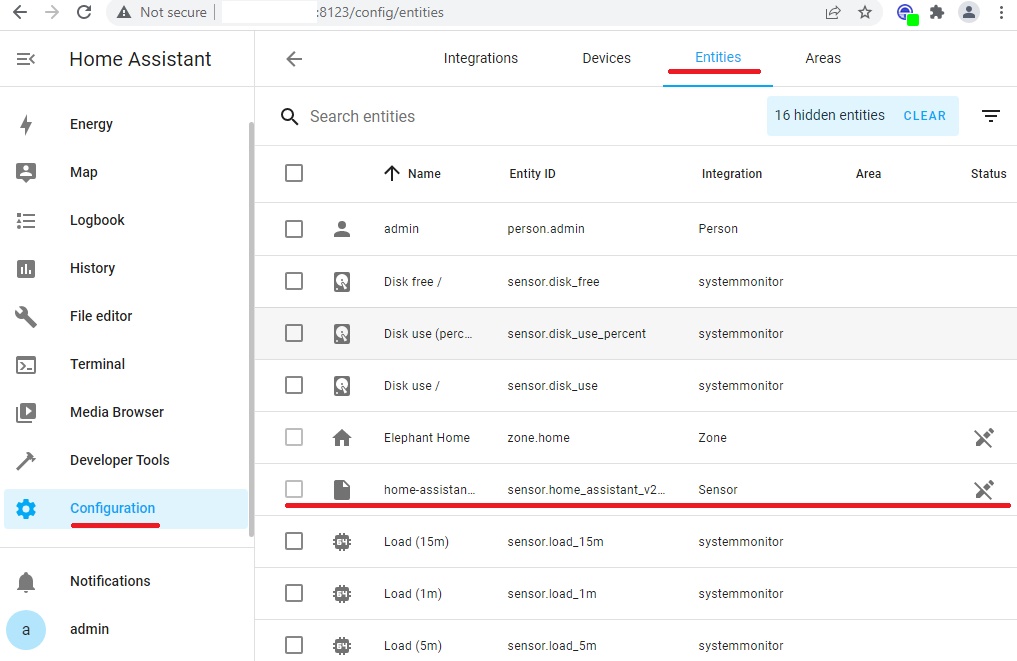
Select this item, and immediately open another pop-up home-assistant_v2.db using the icon at the top right. There we will see the size of the Home Assistant database, which recently measured the sensor as well as historical data. You can see the attributes of the sensor:
This will similarly complete the work with the Home Assistant database size monitoring sensor. A little later, we will adjust the display of this sensor on the Lovelace panels of the Home Assistant.
Internet connection monitoring.
Another important parameter for constant monitoring is the quality of the Internet connection. It’s simple. Home Assistant has the ability to control these parameters using the integration component of Speedtest.net.
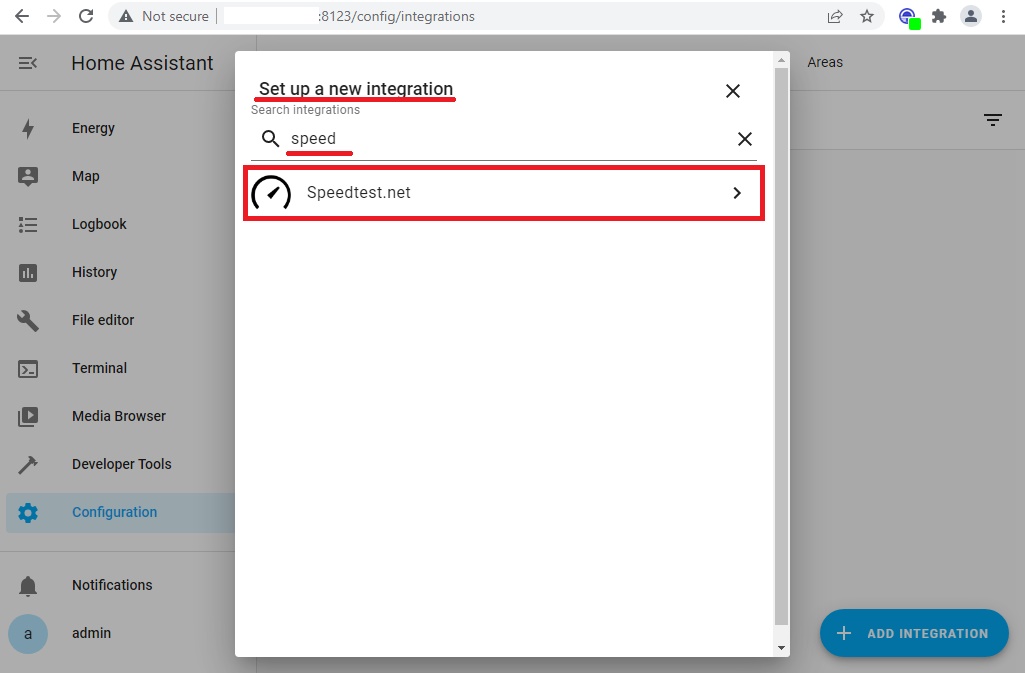
It is very easy to install. Go to the already familiar menu Configuration, section Devices and Services, Integration tab. We add a new Integration: + Add Integration. In the popup window Set up a new integration in the search field enter speedtest.net:
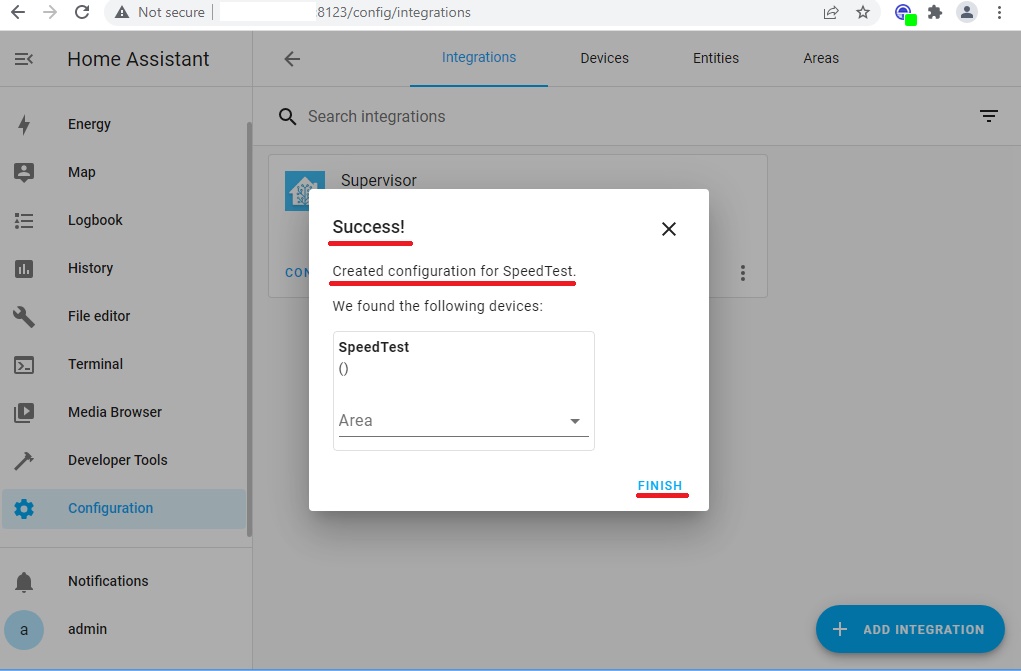
After confirmation of the installation in a short period of time we will receive a message about the successful operation.
After the successful installation of the speedtest.net integration component, we will see it in the list.
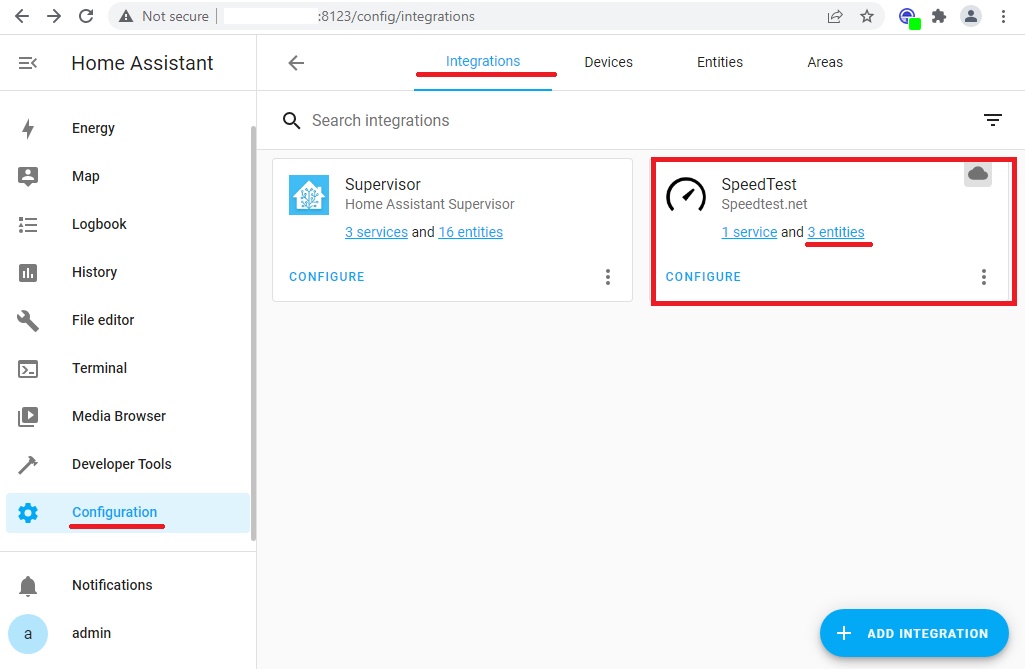
Choose the link 3 entities. And we will see the filtered three sensors.
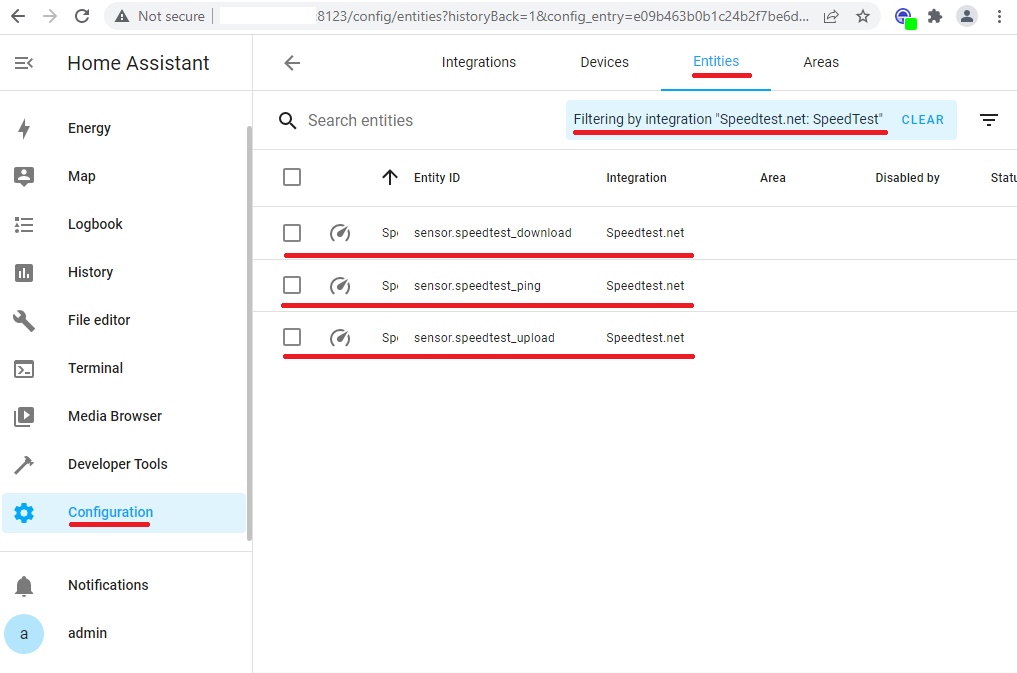
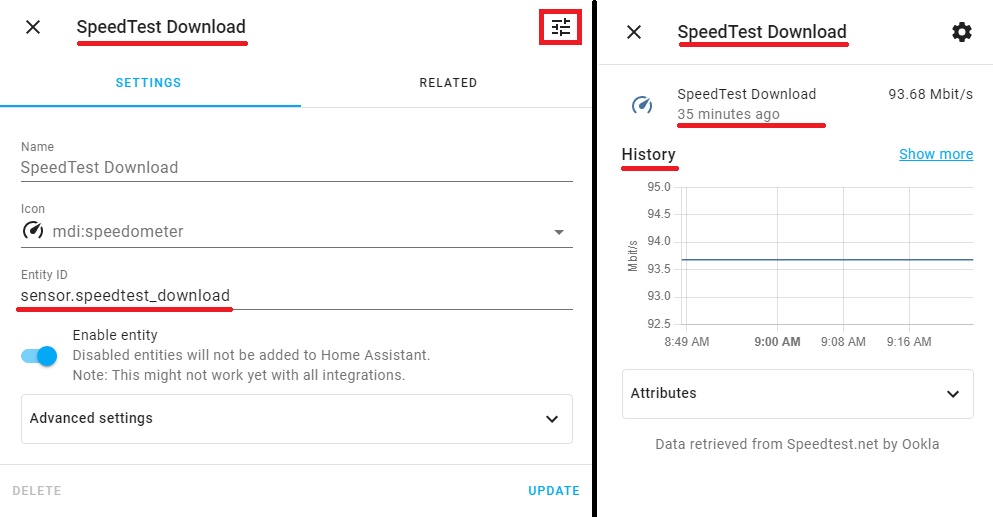
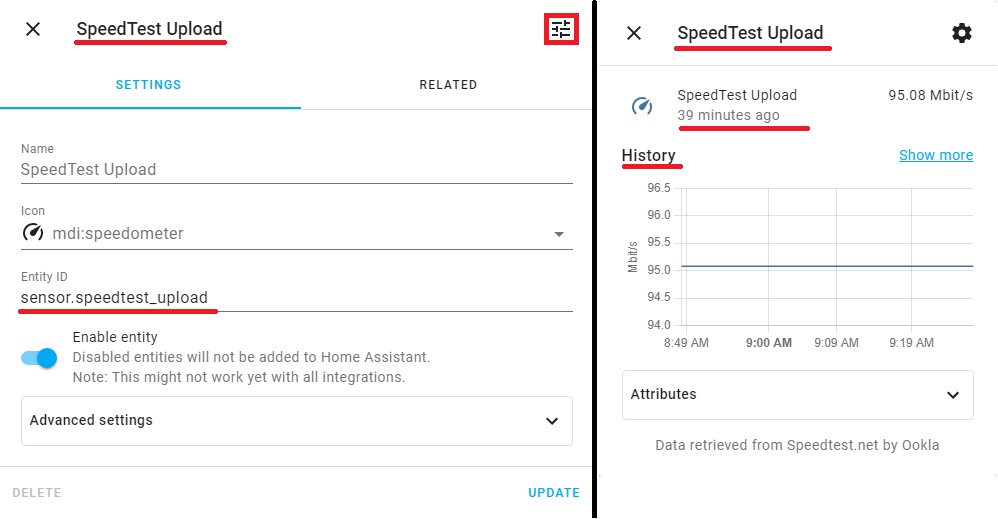
Similar to the steps described above in this article, we will open pop-ups “SpeedTest Ping“, “SpeedTest Download“, “SpeedTest Upload” with information about the status of the sensor and the collected data in historical terms.

This will similarly complete the work with the monitoring sensors of the Internet connection. A little later, we will adjust the display of these sensors on the lovelace panels of the Home Assistant.
Uninterruptible power supply monitoring.
The operation of smart home algorithms primarily depends on a reliable power supply. Our Home Assistant on the Raspberry Pi platform will be connected to the uninterruptible power supply. Therefore, our next step is to set up monitoring of this device.
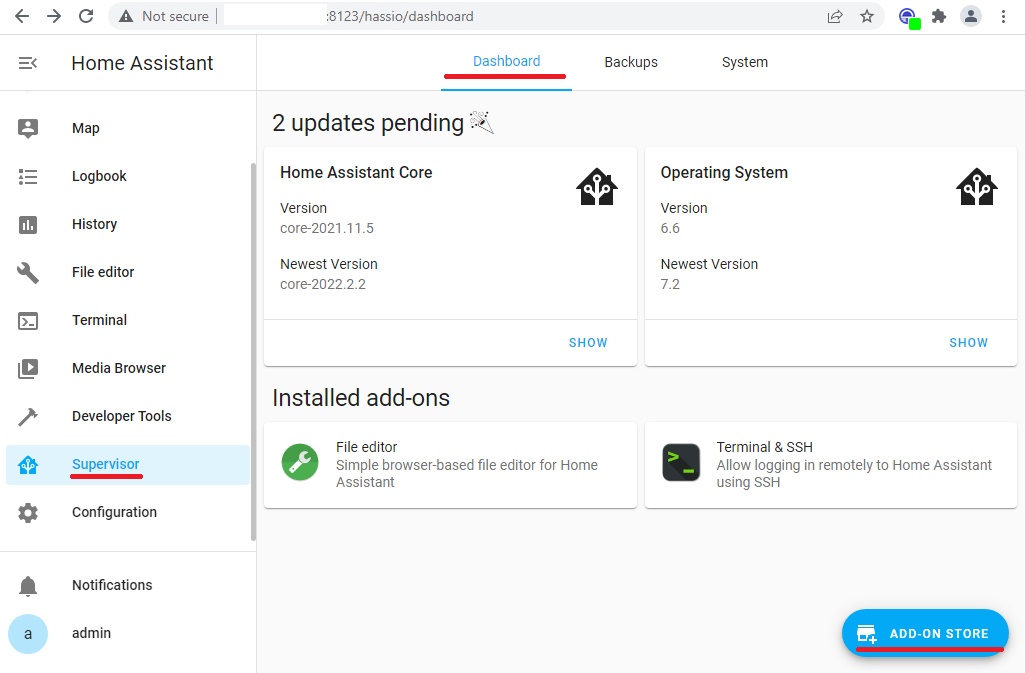
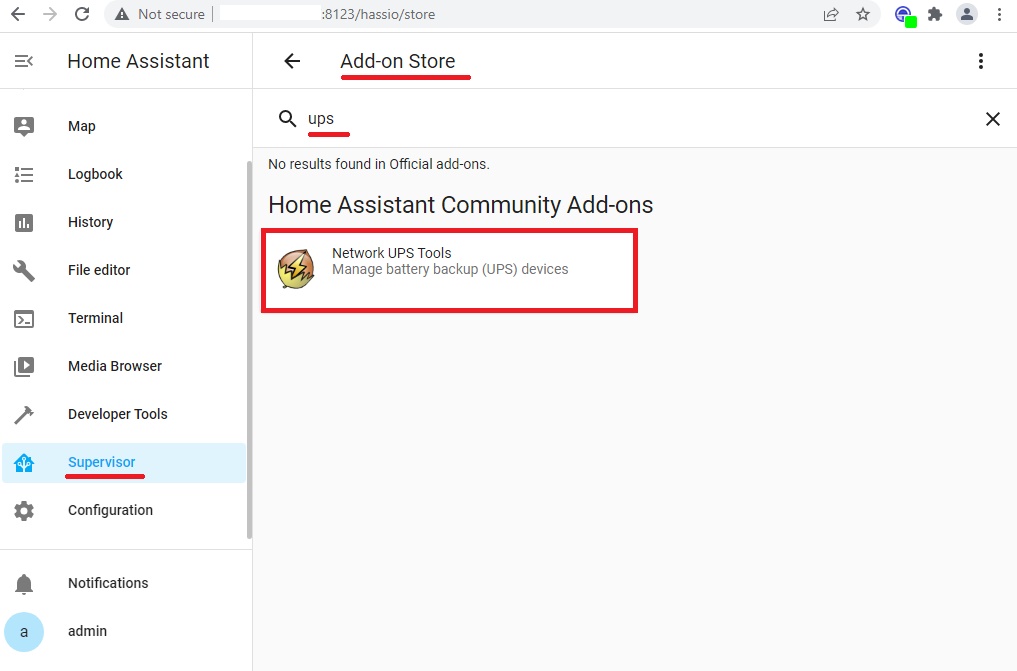
First, let’s add the Network UPS Tools integration package. To do this, in the Supervisor menu, Dashboard tab, select Add-On Store:
Network UPS Tools.
In the search field, enter the UPS:
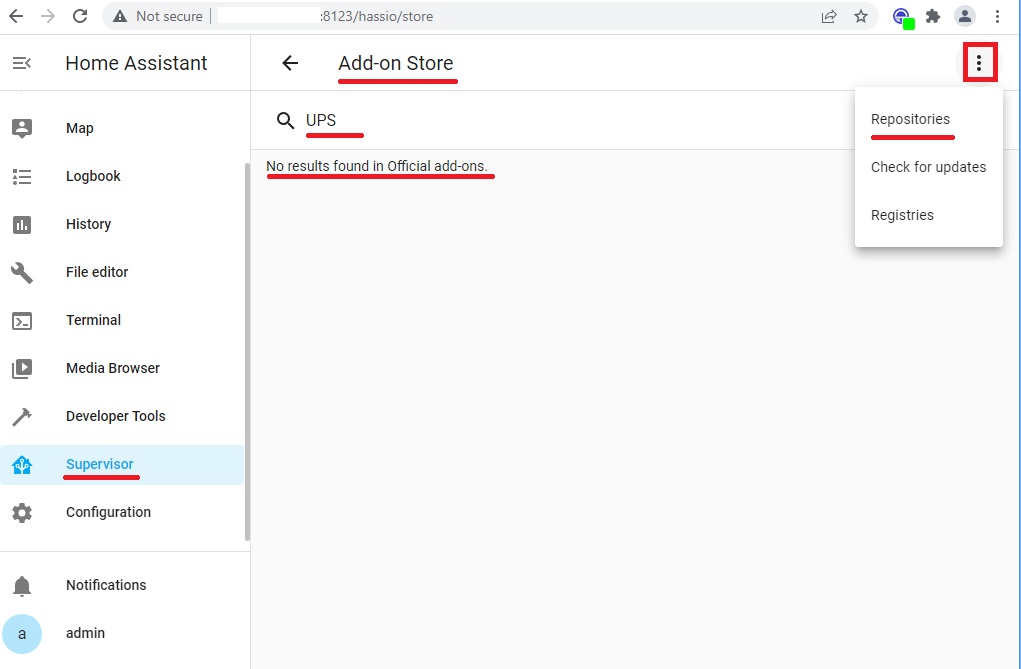
Important: If the search for Network UPS Tools did not return any results, it means that there are no official components. And in the repository community, the search was not performed in the absence of the repository address parameter.
Let’s check this assumption: Call the additional menu by selecting the three-dot icon at the top right of the page. Select Repositories. Manage add-on repositories pop-up window opens:
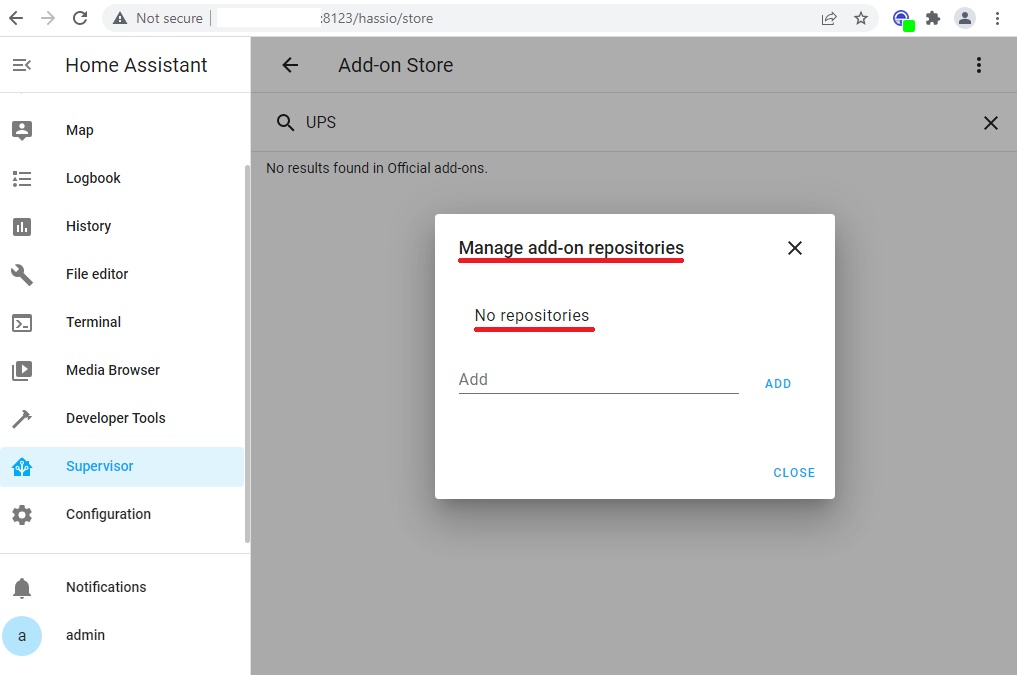
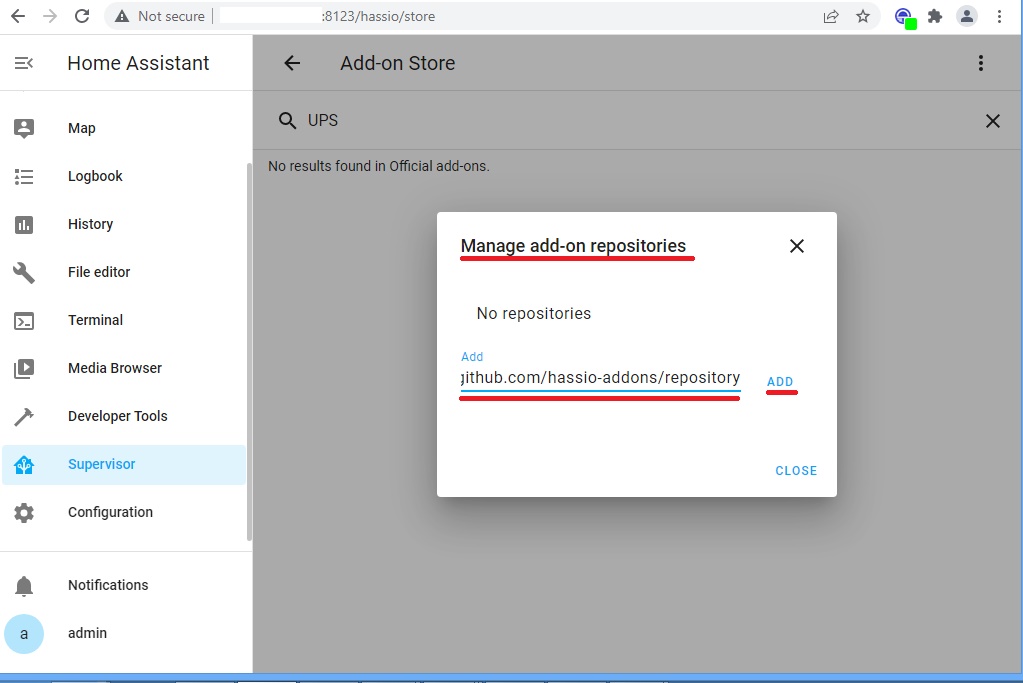
The assumption of the absence of a repository address is true. Therefore, the following address should be added: https://github.com/hassio-addons/repository.
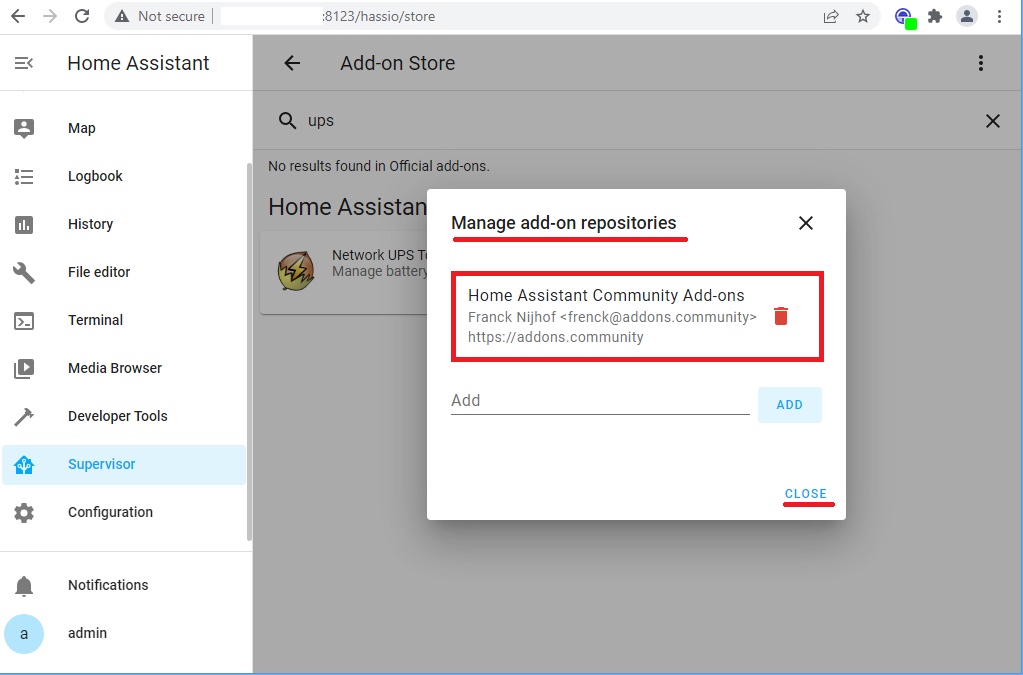
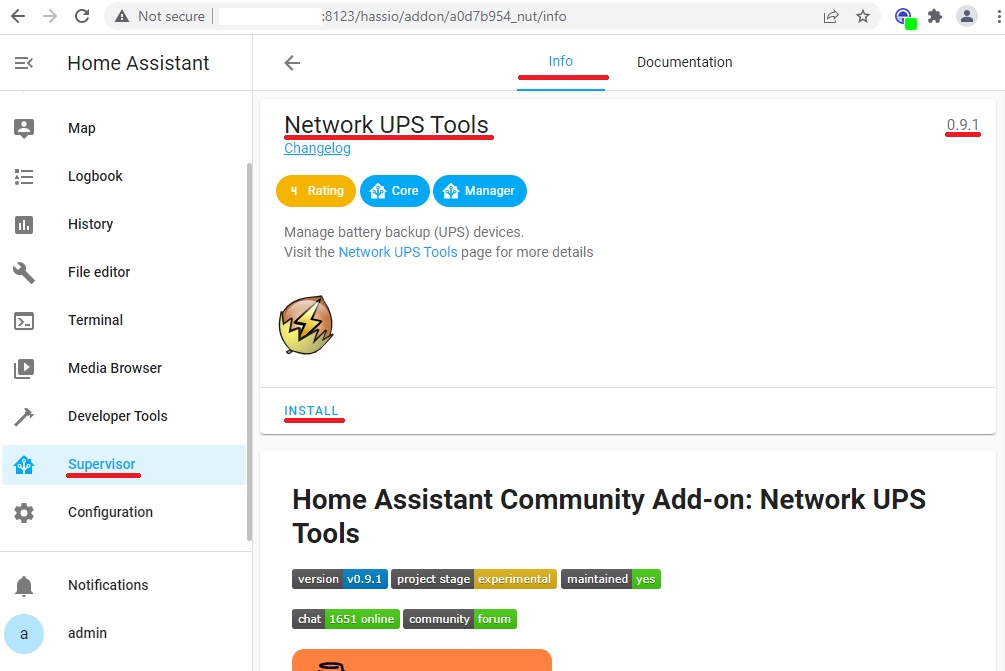
Immediately after adding the above parameter, the Network UPS Tools component we need appeared in the search results:
Next, on the Info tab, we can read current information about this component, version, and if necessary, go to the link to the page of project developers. Choose Install:
Next, check the status of the Start on boot and Auto update options. They must be turned on. A red indicator at the top right of the page indicates that the component is not running. But it’s too early to start.
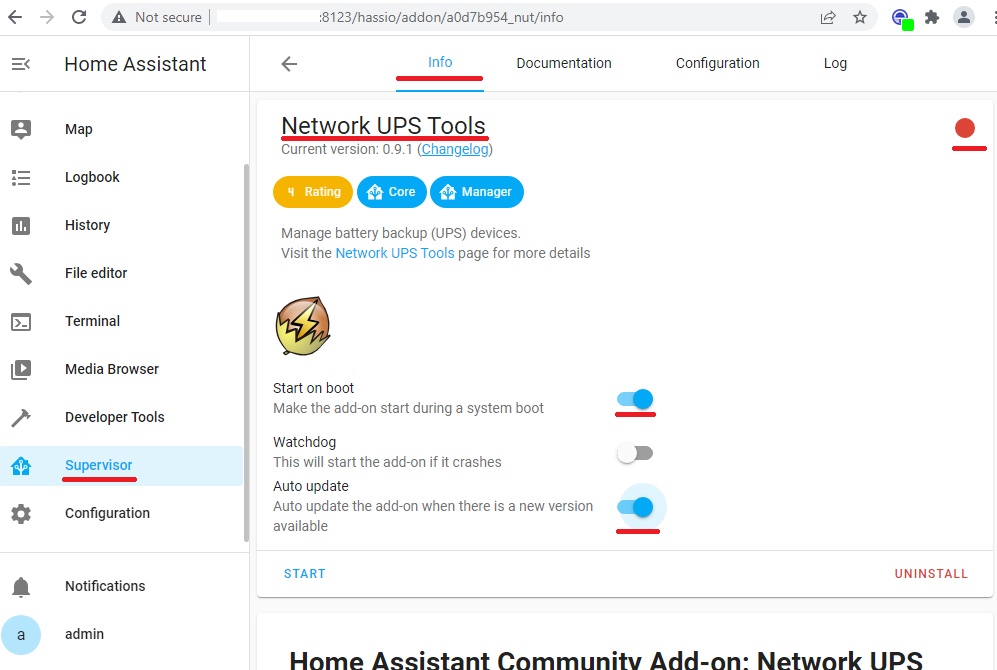
Start on boot and Auto update. They must be turned on.
Next you need to configure the settings of this application. To do this, go to the Configuration tab and add the following code in the Options section:
devices:
  - config: []
    driver: usbhid-ups
    name: MGEEv1150
    port: auto
mode: netserver
shutdown_host: 'false'
users:
  - actions: []
    instcmds:
      - all
    password: 'Pa$$wOrd'
    username: nut
list_usb_devices: 'true'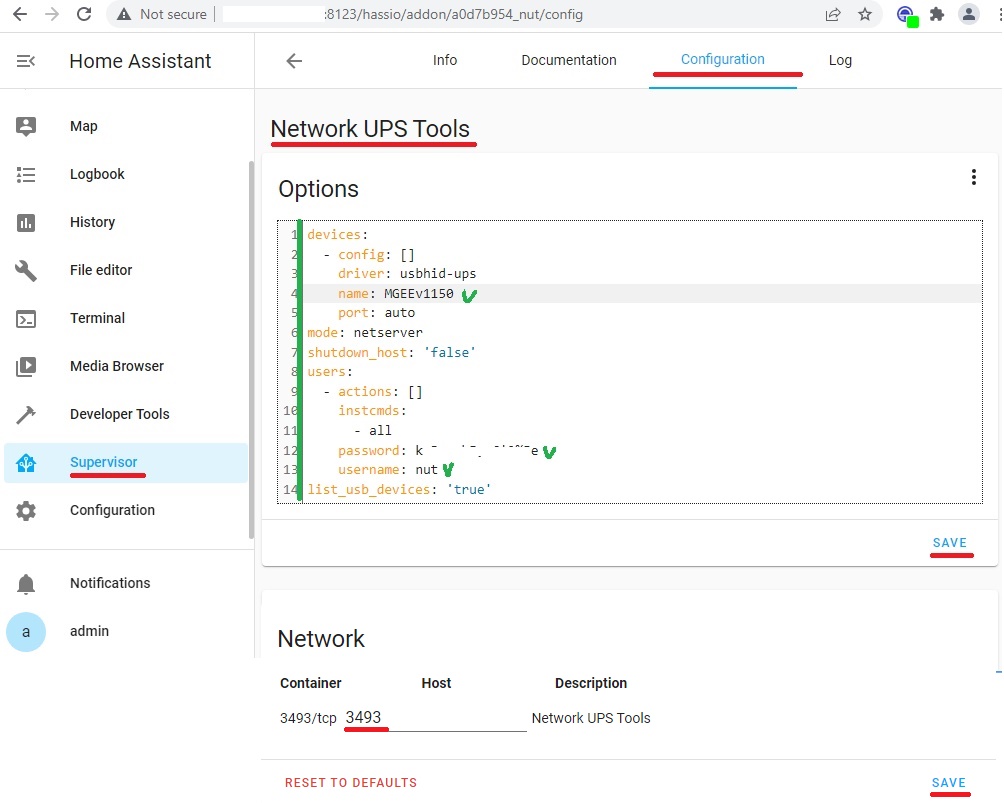
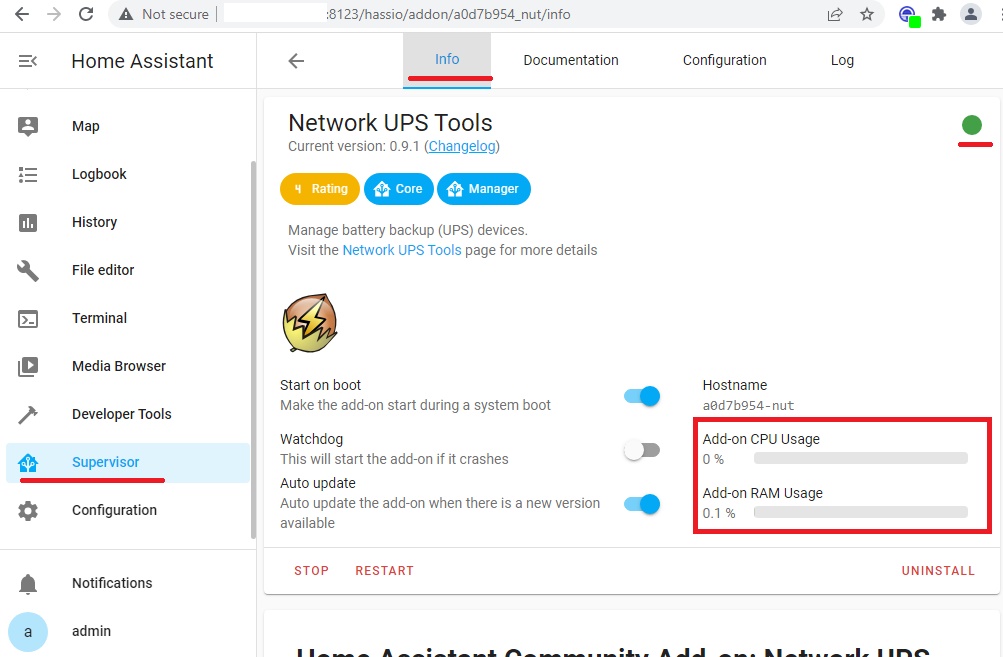
We save the settings in the Options section. And in the network section, specify the host port on which data will be exchanged between the Client and the Network UPS Tools server. Save the settings in the Network section. And start the component. If all is well, a green indicator will appear at the top right of the page and at the bottom right indicators of CPU and memory usage by this component.
This is the end of the work on setting up the so-called Network UPS Tools server part, but that’s not all. That’s only half the job. You still need to configure the client part so that the Home Assistant can receive data.
To do this, we need to add the appropriate integration: Network UPS Tools (NUT). This can be done similarly to the steps described above (for example in the section with SpeedTest.net).
Go to the already familiar menu Configuration, section Devices and Services, Integration tab. We add a new Integration: + Add Integration. In the popup window Set up a new integration in the search field, enter the ups:

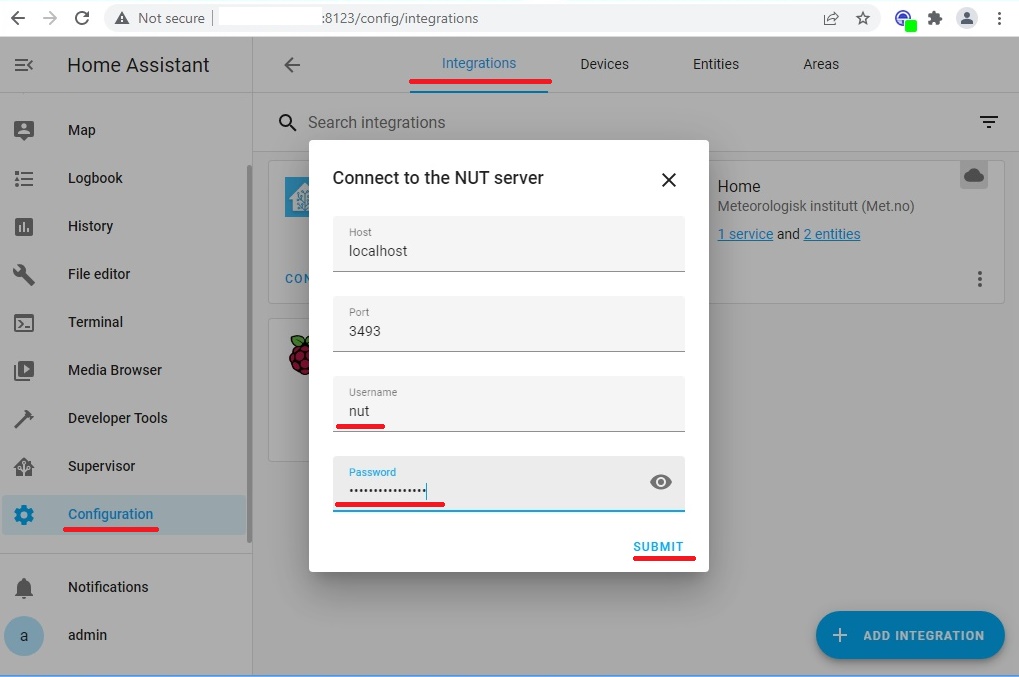
Component found. Select this element and get to the Connect to the NUT server pop-up window. We only need to enter two parameters: Username and Password, which we specified in the Network UPS Tools Add-on configuration earlier.
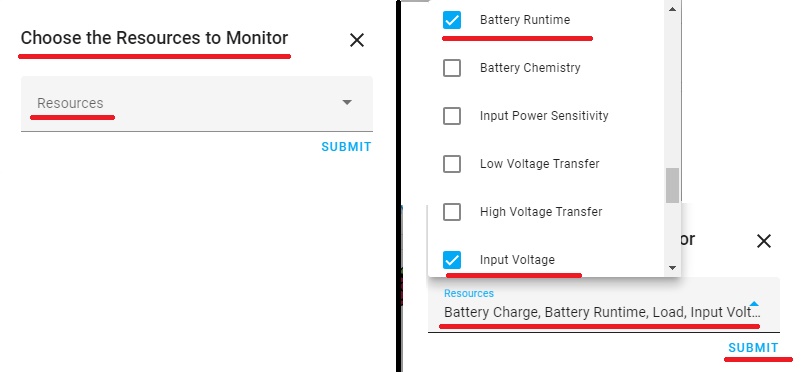
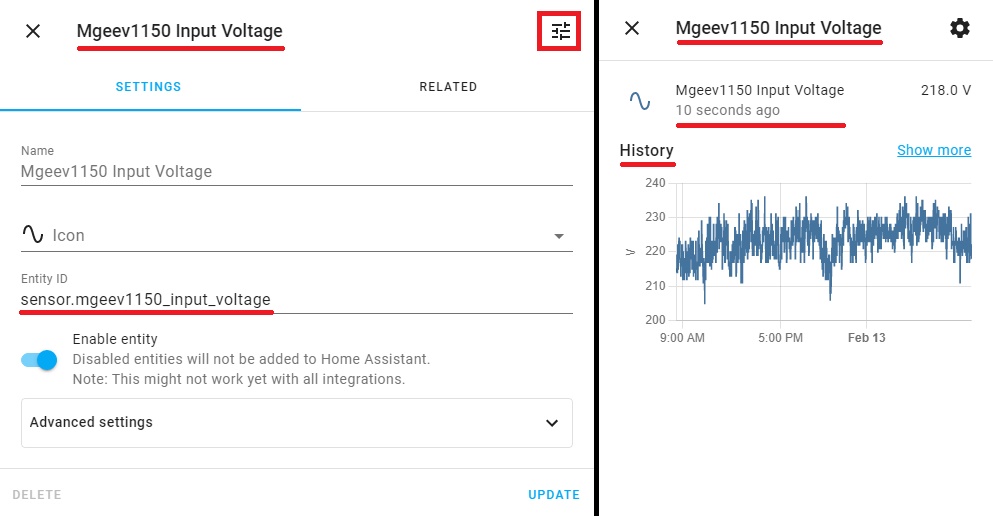
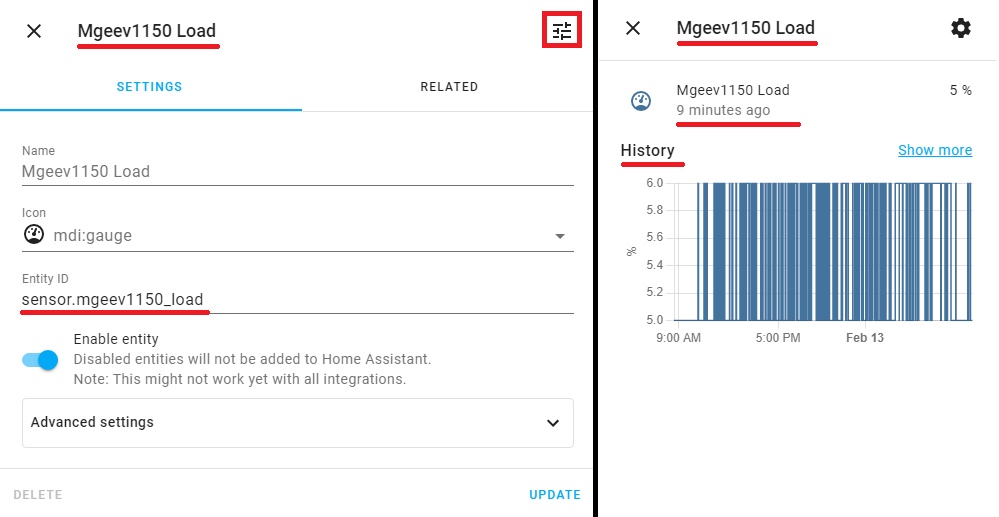
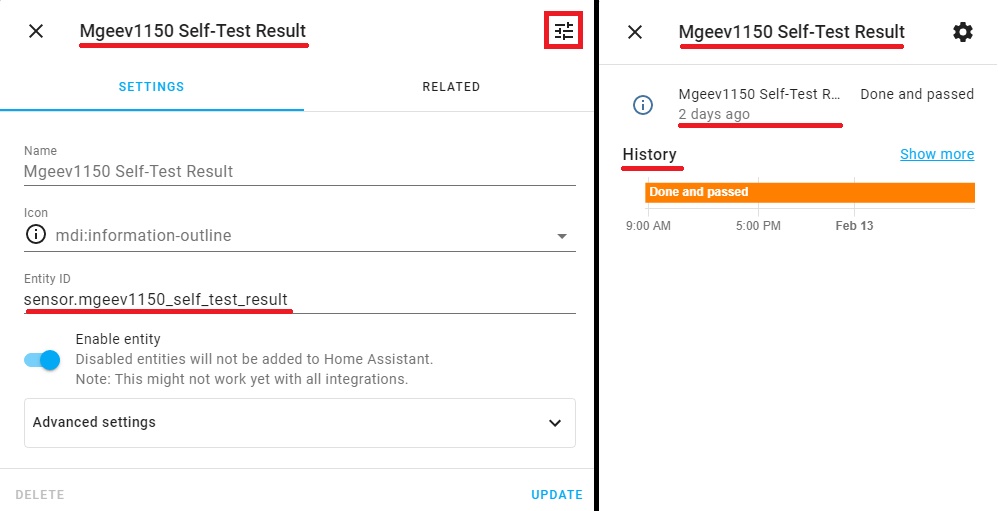
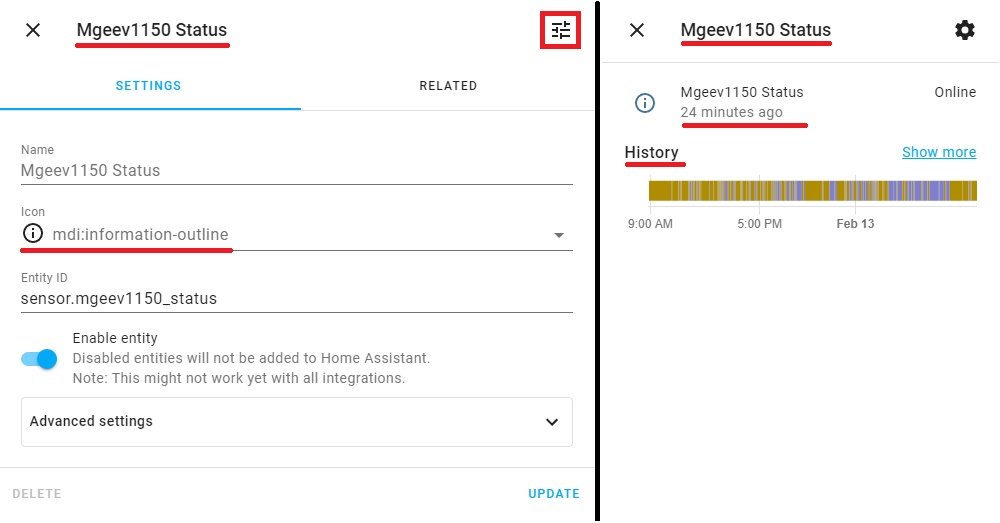
If we did not make a mistake in the user and password parameter and the previous steps of setup are performed correctly, we will be asked to select a list of resources (sensors) for monitoring. You can choose all, I chose only the following: Battery Charge, Battery Runtime, Input Voltage, Load, Self-Test Result, Status.
In the final dialog, you will be prompted to link this object to the area of your Smart Home. We will not make this binding at the moment.
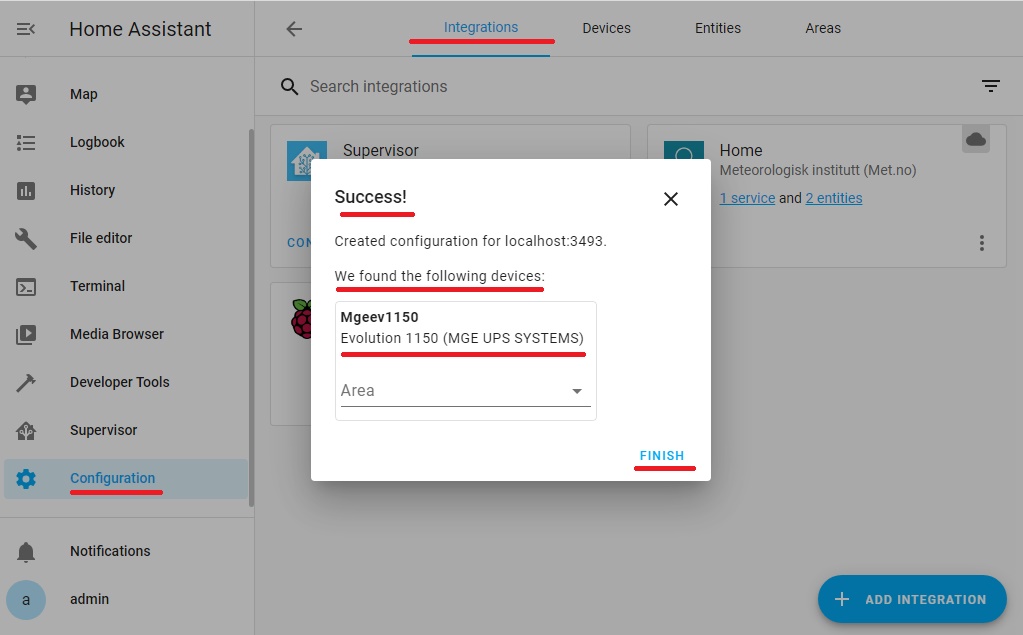
Congratulations! All our actions were performed successfully.
The list of integrations includes a new integration component Network UPS Tools (NUT), which receives data from the server.
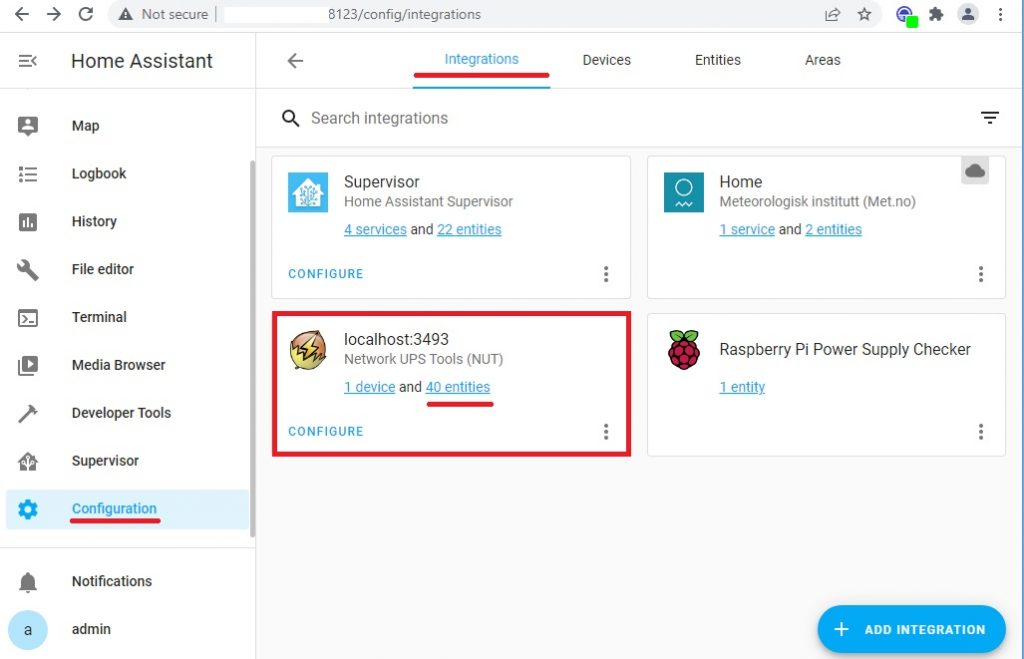
Select the 40 entities link to go to the list of filtered sensors. The sensors we have selected are active, all others are off.
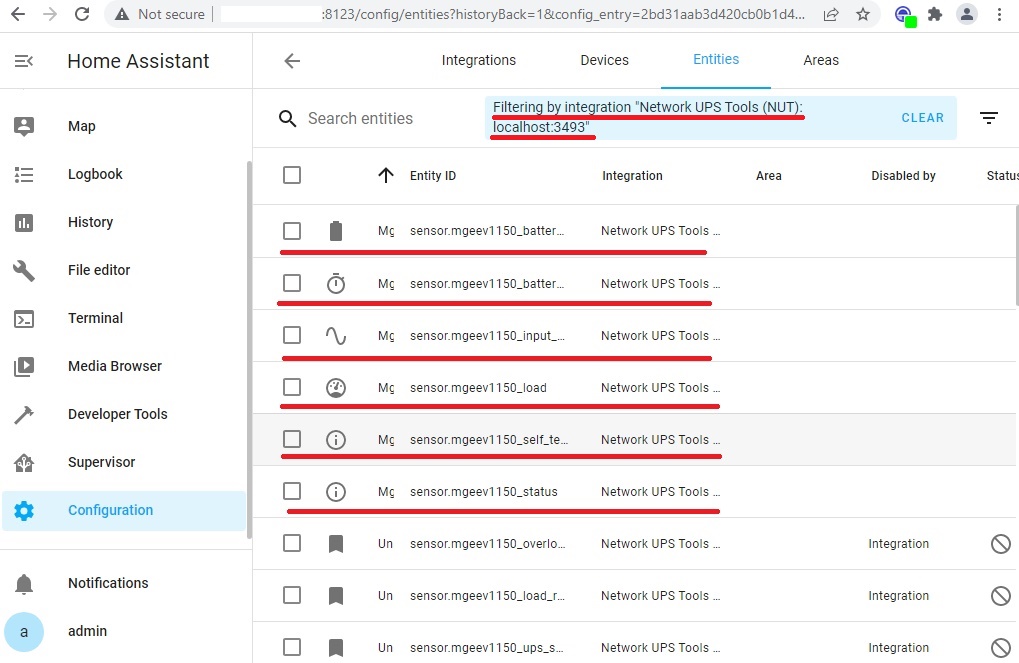
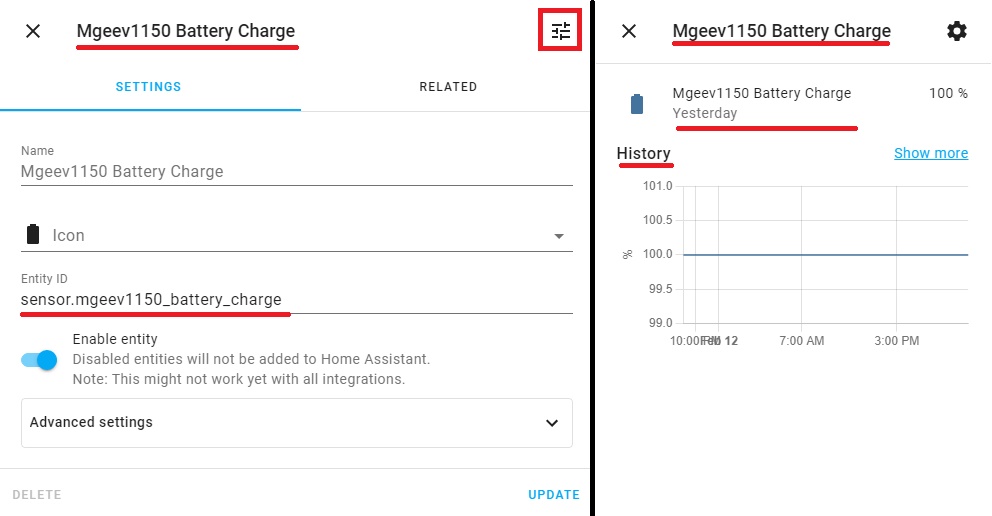
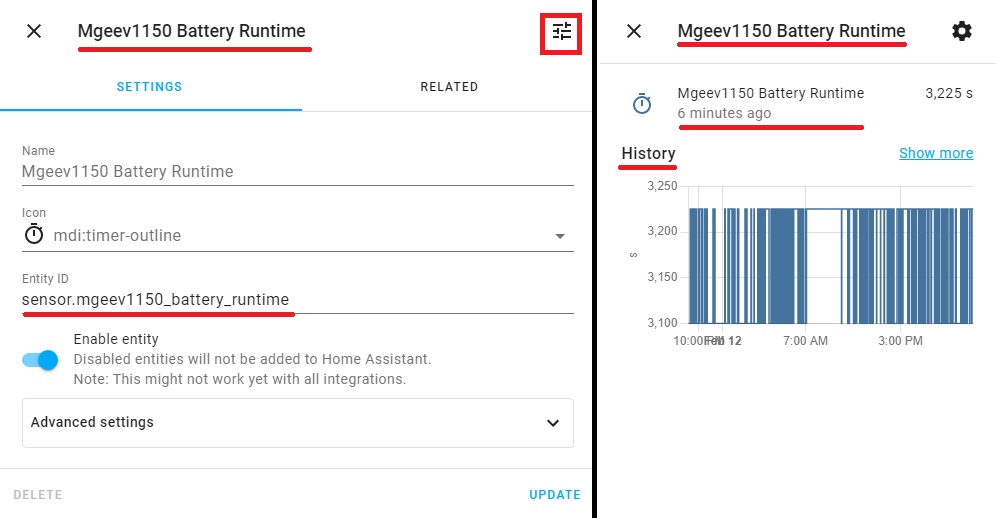
Similar to the steps described above in this article, we will open pop-ups with sensor parameters Mgeev1150 Battery Charge, Battery Runtime, Input Voltage, Load, Self-Test Result, Status and data collected in historical terms.
This will similarly complete the work with Network UPS Tools (NUT) monitoring sensors. In the following publications, we will explain how to configure the display of these sensors on the Lovelace panels of the Home Assistant.
What’s next?
So at the moment we know about the health of the hardware, software and database of our Smart Home core. We learned how to add and customize Add-on application components and Integrations. We also have information on the status of the power supply and the parameters of the uninterruptible power supply.
Do not forget to update the system and back up.
At this stage we will pause, and in the next publication we will tell about:
- Large-scale Hardware Upgrade Raspberry Pi 4.
But about this in the next post!
See you,
Sincerely, AIRRA!